Following the pandemic-induced crash of 2020, we developed our new Gorilla Index as we recognized that just 10 mega-cap momentum stocks accounted for a disproportionately large 27% weight in the S&P 500 Index. This dynamic hadn’t been seen since the Tech Bubble of the late 1990s, where our original Gorilla Index contained a slightly larger number of stocks (17) and accounted for 25% of the S&P 500’s market capitalization.
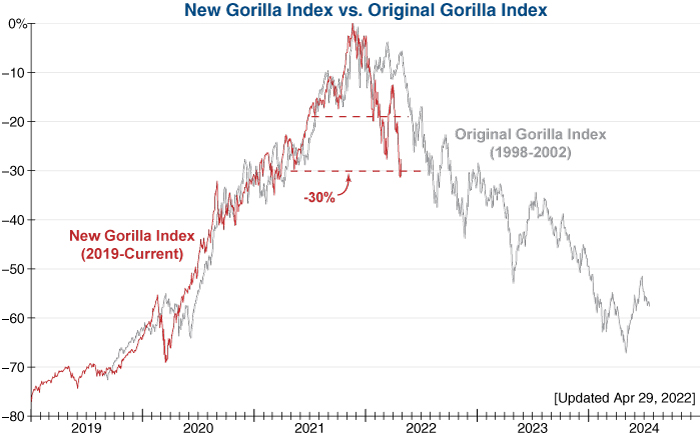
Our new Gorilla Index peaked last November and sent a warning flag early this year after it broke through initial technical support (see graph below). Since then, it has not only failed to regain its first support level but is testing its next major support level after falling over -30% from last year’s peak. If our new Gorilla Index does not regain this level in the weeks ahead, it would confirm that there has been a worrisome shift in investor psychology. And as shown by the overlay on our original Gorilla Index from the Tech Bubble period, this could mean that losses in these mega-cap momentum darlings may just be getting started.