
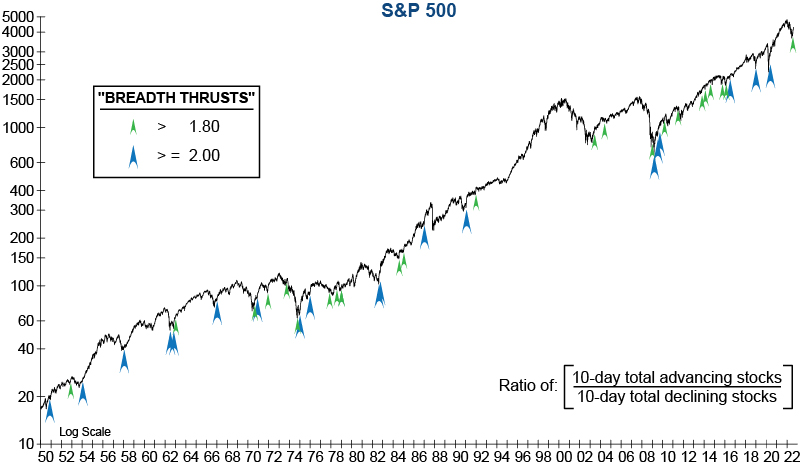
Historically, one of the most reliable indications that a new bull market has arrived is the emergence of breadth thrusts. While there is no single standard for what qualifies as a breadth thrust within the technical community, many consider a thrust to have occurred when advancing stocks outnumber declining stocks by a 1.8:1 ratio over 10 days on the NYSE. However, we know the most reliable signals are marked by breadth thrusts of 2.0 or greater over a 10-day period (see graph below).
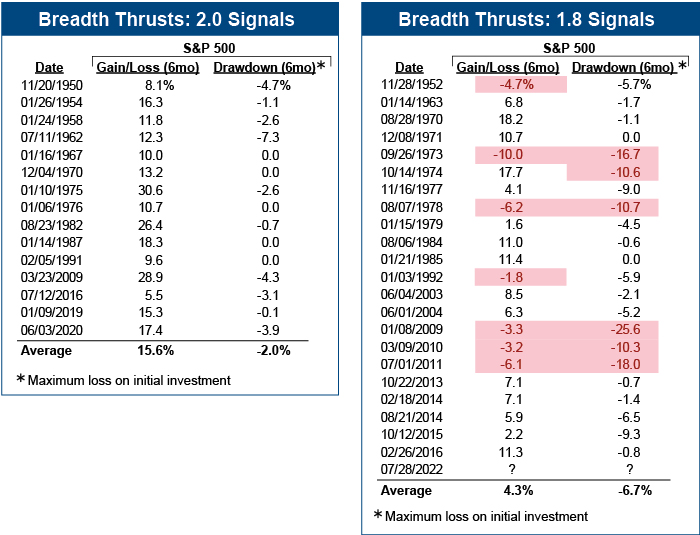
Both the 1.8 and the 2.0 breadth thrusts have positive outcomes on average, yet there is still a wide disparity between the risk and the return of these two signals. For example, since 1950 thrusts of 2.0 have never had a negative return six months later, nor a drawdown of more than -10% over that period. In contrast, thrusts of 1.8 have had a negative six-month return nearly a third of the time, and over one-quarter of its signals have had double-digit drawdowns follow (highlighted in red on table below).
Today, while we have gotten the lesser of the two signals, it is the 2.0 breadth thrusts which have historically confirmed the arrival of a new bull market. So, with the absence of this higher-quality signal and the complete lack of a bullish Selling Vacuum in our Negative Leadership Composite (see the latest issue of InvesTech Research), we are not getting the positive confirmations that would typically occur if the bear market low was already in place.
Eli Petropoulos, CFA – Sr. Market Analyst