
“How do I hate thee? Let me count the ways…”
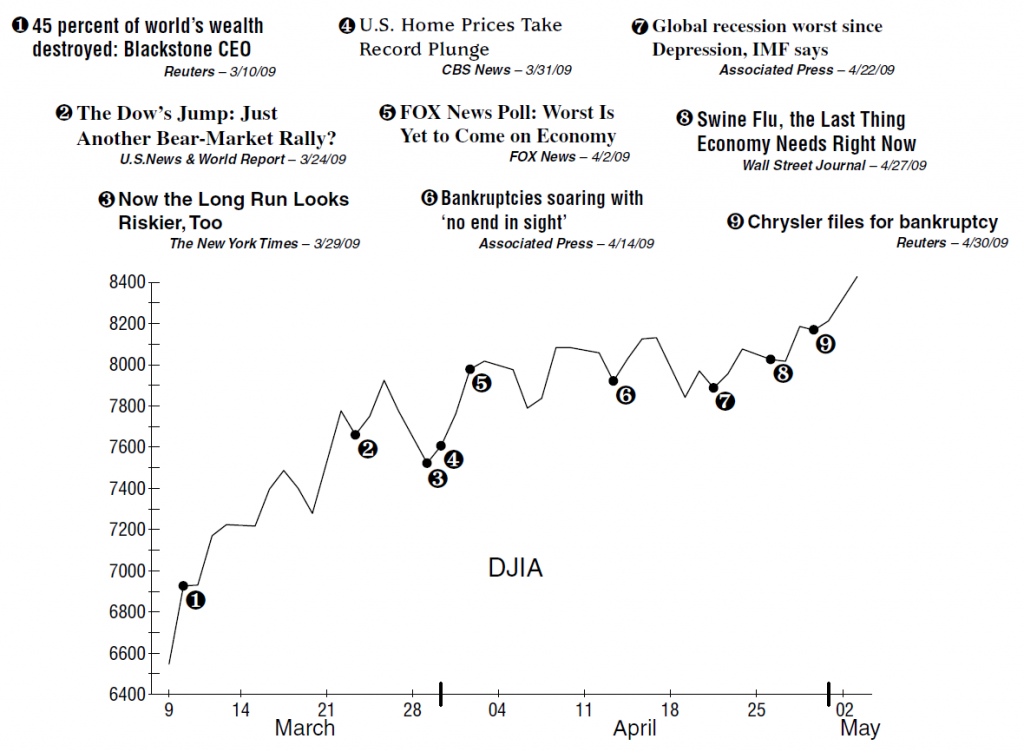
Without a doubt, this is already one of the most hated bull markets in history! Both analysts and the media are finding countless things wrong with the rally, the U.S. economy, and –it seems– the outlook for the entire world:
Global Recession Deepens, Adding to U.S. Woes
The Kiplinger Letter, 5/4/09
From the swine flu outbreak, to soaring bankruptcies and foreclosures, to weak trading volume and ominous selling by corporate insiders, Wall Street investors have no shortage of worries on their minds. So why does the market continue to move relentlessly higher?
Inside this issue, we provide the historical answer to that question – which our more seasoned subscribers know already. Just eight weeks ago, our March 13 issue laid out the technical arguments for an important market bottom…
A Buying Opportunity of a Lifetime?
… it is a historically indisputable fact that we are heading toward a buying opportunity of a lifetime.
InvesTech Research, 3/13/09
…and thus far, the low that week (at DJIA 6,547) has proven to be the bear market low.
The ultimate question: What now?
Are we in a new bull market or is it a bear market rally? If it is a new bull market, will it be a cyclical bull that is destined to a short life span or fail to reach old highs? And is it too late to buy, with the market already rebounding over 25%? All of these worries simply add to headlines now weighing on investors’ shoulders.
So let’s tackle some of these major concerns…
Climbing a Wall of Worry
Every seasoned investor knows that bull markets climb a proverbial “wall of worry” during their early months of existence. Yet each and every time, it doesn’t get any easier. There is always an emotional tug-of-war between gloomy media headlines, and the slow methodical improvement in the technical outlook…
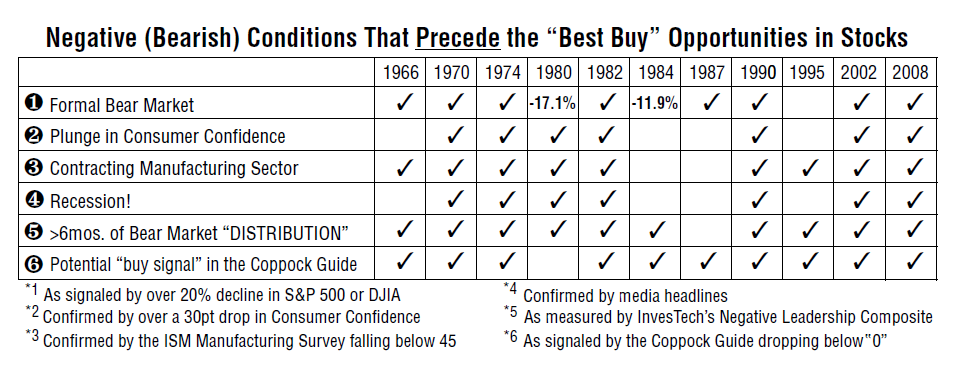
But with all the blocks in place for a potential “best buy” opportunity in stocks [see table below], we need to pay close attention to the technical outlook – which is dramatically changing!
NLC: Now Bullish
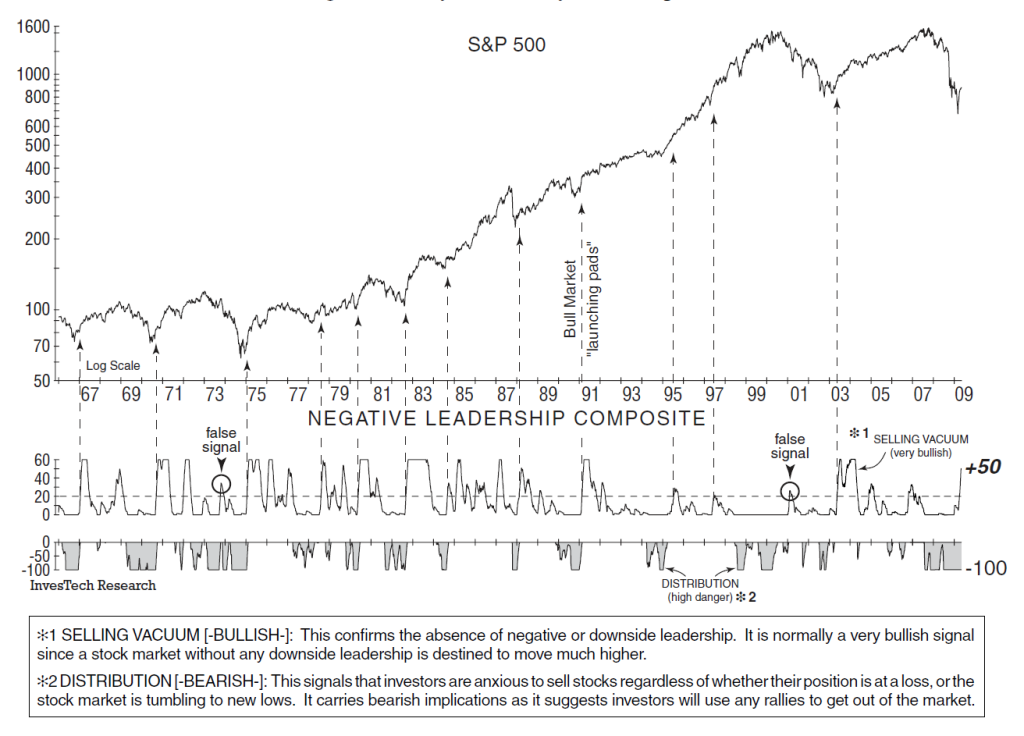
The most dramatic technical change since our last issue has been a strong and steady increase in the bullish “SELLING VACUUM” [*1] from our Negative Leadership Composite. Designed to measure the absence of downside or bear market leadership, this kind of +50 reading is synonymous with past bull market launching pads (see dashed arrows). Note there have been only 2 false signals (greater than +20) from our NLC Selling Vacuum in the past 42 years – and both occurred at significantly lower levels.
We also want to point out that the lingering “DISTRIBUTION” [*2 –lower half] is not a problem from a technical viewpoint. Internal calculations show that bear market Distribution ended on the March 9 low, and has not been “added to” since then. On climactic V-shaped bottoms, it is not unusual to see a lag in this component. For example, at the end of the 1973-74 bear market, there was a 14-week residual lag between the market bottom and when Distribution left its -100 reading. In 1987, there was an 11- week lag. Currently, we’re only 8 weeks past the March 9 bottom.
BREADTH: Positive Divergence
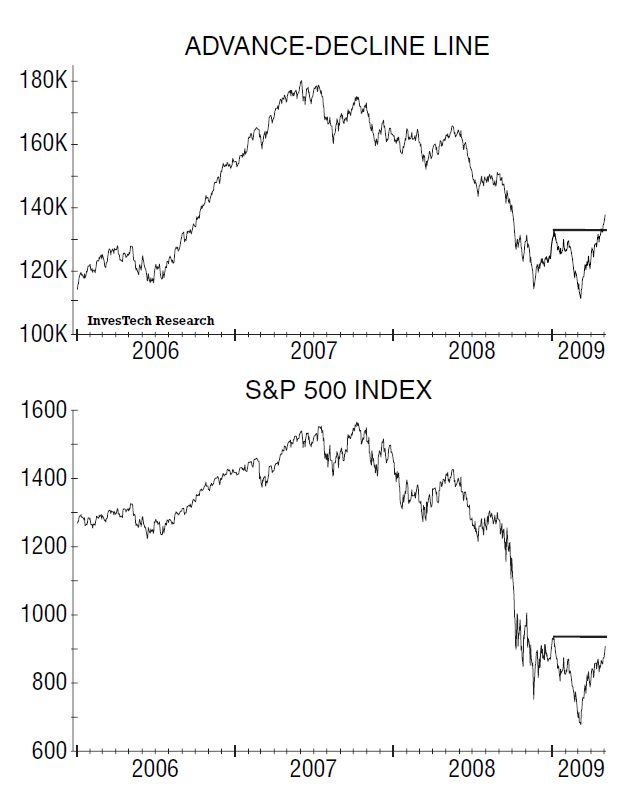
Throughout the lengthy 1929-32 bear market, as well as the 1973-74 bear market, there was never a “positive divergence” in market breadth. In other words, the advance-decline line [cumulative sum of daily advancing issues minus declining issues] led the bear market path every step of the way down.
So to see a positive divergence today is yet another confirmation this bear market may be over. The A-D Line has broken well above its January rally high, thus leading the S&P 500 upward since the March bottom. Some will argue this breadth gauge is less reliable since more ETFs and closed-end bond funds are traded on the NYSE. Perhaps. But we’ll simply let history speak for itself and give this technical tool our benefit of doubt until proven wrong.
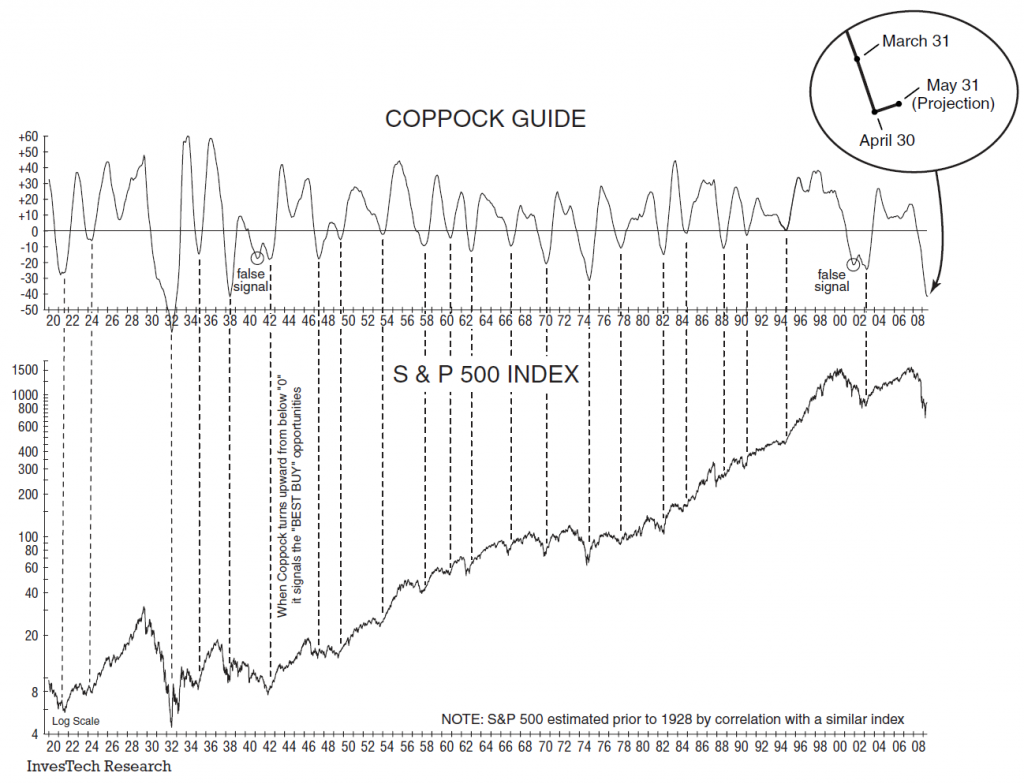
COPPOCK GUIDE: Is a Buy Signal Imminent?
If recent market gains hold, then a “Buy Signal” appears imminent in the Coppock Guide this month.
The Coppock Guide was developed over 50 years ago by Edwin S. Coppock. Its historical value lies in signaling or confirming the best, low-risk buying opportunities in history – and it is one of the few technical tools that would have kept anxious investors from stepping prematurely into the middle of the record 1929-32 debacle or the 1973-74 bear market.
This index is actually the 10-month weighted moving total of a 14-month rate of change plus an 11-month rate of change of a market index. In mathematical terms, it’s really just a momentum oscillator. Because of this, it reverses direction when the long-term momentum or velocity in the market peaks. After dropping to ‘0’ or below, a mere 1-point upturn in this index can usually be treated as an excellent buying opportunity.
Some of the best (most important) buying opportunities have appeared when the Coppock Guide bottomed at a negative extreme below -20, including 1921, 1932, 1970, 1974 and 2003. And often, the more negative the Coppock Guide is when it turns upward, the more impressive the profits ahead. Under this guideline, only two false signals in 88 years have been recorded – once in 1941 and again in November 2001.
Today, the Coppock Guide is at its most oversold level since the bear markets of the 1930s – over 70 years ago. As a monthly indicator, we won’t know for certain whether a formal buy signal has been triggered until the end of the month. However, forward testing –based on current data– reveals the Coppock will turn upward from below ‘0’ if the market stabilizes near present levels or continues rising. Remember – this is a projection, not necessarily a certainty. So stay tuned…
TWO MORE important shifts underway…
Consumer Confidence:
After hitting a record 42-year low in February, Consumer Confidence just registered its largest monthly rebound in almost four years [ 1]. While no guarantee of an economic recovery ahead, this is clearly a move in the right direction. More importantly, the majority of that confidence rebound came in the “future expectations” component of this gauge – representing consumers’ outlook six months ahead. And our tracking of the “future minus present” surveys now shows a clear uptrend [2] … strikingly similar to the path that has typically led out of past recessions.

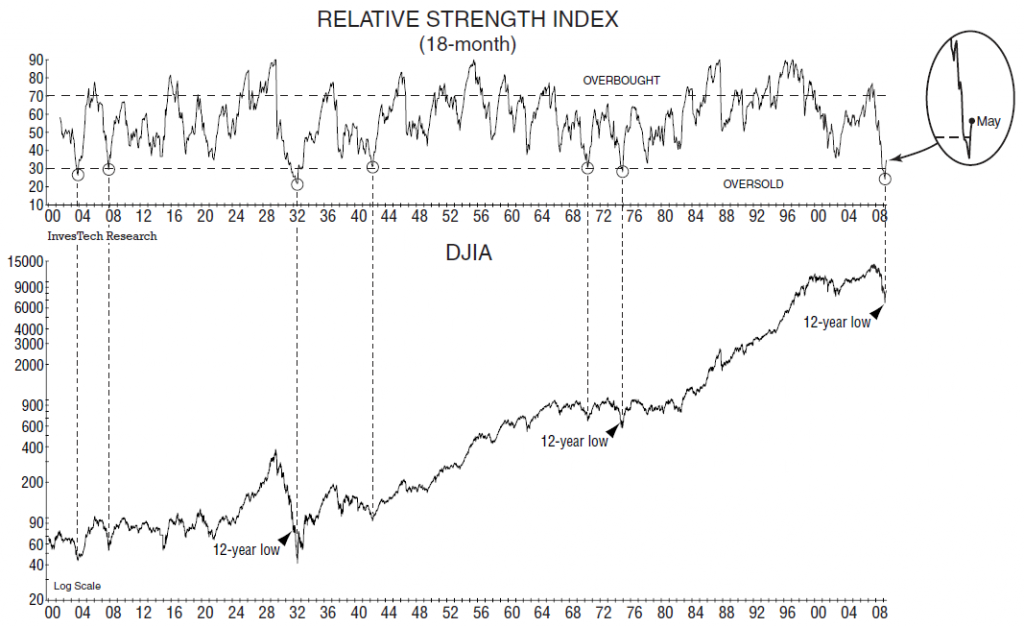
RSI (Relative Strength Index):
Here is what we said in our March 13 issue…
One of the technical gauges of oversold (or overbought) extremes in the stock market is the Relative Strength Index (RSI), developed by Welles Wilder. A long-term (18-month) version of this RSI has proven a valuable tool in helping to identify potential market bottoms –or the best buying opportunities for investors.
Basically, the Relative Strength Index compares the cumulative upward price changes over a defined period relative to the cumulative downward price changes. Here, once again, extremes in oversold conditions on Wall Street inevitably create the best buying opportunities. And the most oversold conditions can sometimes create a buying opportunity of a lifetime – at market levels that are never seen again!
InvesTech Market Analyst – March 13, 2009
Since then, this Relative Strength Index has turned decisively upward in response to the latest rally. Notice that no upturn of this magnitude from this level has proven to be a false signal in the past 109 years! It’s just one more cumulative piece of evidence that the stock market low eight weeks ago may have been an important bottom.
PERSONAL PERSPECTIVE
Housing – Light at the end of the tunnel
Don’t count us among the raging bulls. If anything, we might be called a “cautious bull with some residual concerns about systemic mortgage risk.” But there, too, the outlook seems to be improving…
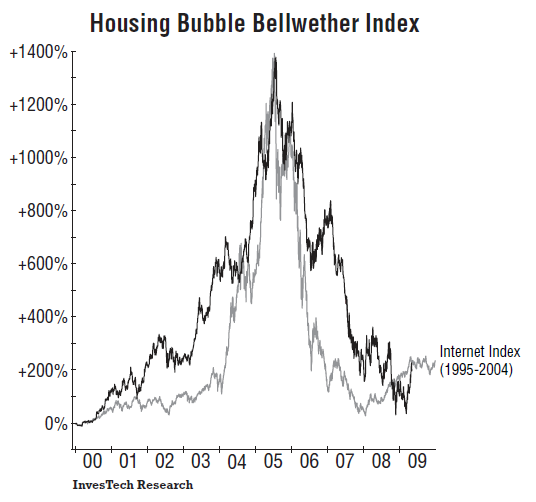
First, our Housing Bubble Bellwether Index –which forewarned us in 2005 of the housing debacle ahead– is coming off a double-bottom, in which the March 9 low was not significantly lower than the low late last year. Even to this day, the parallel path of these housing-related stocks to the bursting of the 1990s Internet Bubble has been amazing!
In addition, much of the excess price inflation in housing appears to have been resolved. Nationally, the median family home price has fallen an unprecedented -29% since mid-2005, as shown in this graphic:
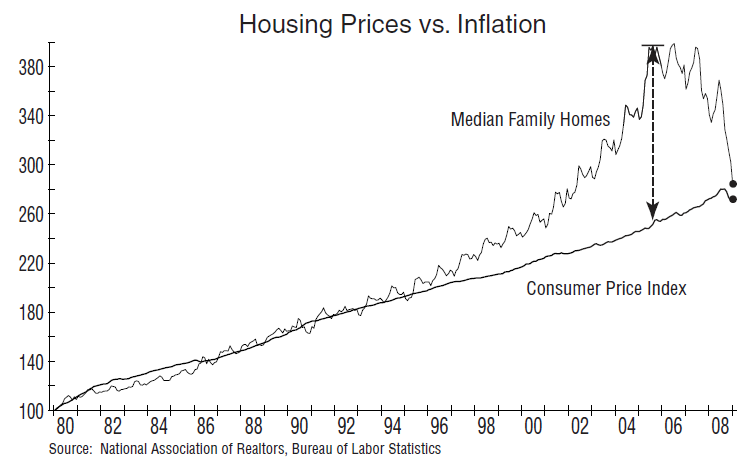
That does not mean that home prices won’t continue lower or overshoot the long-term inflation trend before hitting bottom in 2010. However, it suggests to us that the majority of damage is over. [And we reserve judgment on those areas of the country that peaked late, like Whitefish, Montana.]
It is also encouraging to see an upturn in the NAHB (National Association of Home Builders) surveys on both Builder Confidence and the traffic of prospective buyers. With inventories now down to pre-bubble levels, we believe this upturn will have more staying ability than the temporary rebound in 2006.

Battling the Bears
Frankly, we can come up with all sorts of reasons to remain a bit cautious about the market. Yet our objectivity compels us to gradually move our allocation in the direction of the evidence – and right now that is to the bullish side. Here’s what is not influencing our decisions, and why…
Volume is too light for this to be a new bull market!
This is an argument that we’ve heard more than once, and has some historical validity. Volume on this rally, and particularly on big “up” days has been disappointingly average. But one of the reasons for this is that most bear market bottoms are accompanied by a dramatic shift in Fed policy, accompanied by interest rate cuts. This time around, the Fed has no interest rate cards left to play. So regardless of when this bear market bottom occurs (or if it has already occurred), we expect volume to lag.
Sentiment never shifts bullish this fast – except on bear market rallies.
We’re heard this statement from several noted analysts, however, we don’t see any factual basis for it. In fact, we continue to see a lot of skepticism and doubt (see “Wall of Worry” headlines on page 2). And currently at 8 weeks after the March bottom, the AAII survey shows only 36% of individual investors are bullish – compared to 49% bullish at the same time after the last bear market’s double-bottom in March 2003.
Meanwhile, the Investors Intelligence survey shows only 40% of advisory services have turned bullish. That compares to 48% bullish at 8 weeks after the March 2003 low, 37% bullish at 8 weeks after the 1982 bottom, and 53% bullish at 8 weeks after the December 1974 bottom. Bottom line: there seems to be more doubt than bullishness today.
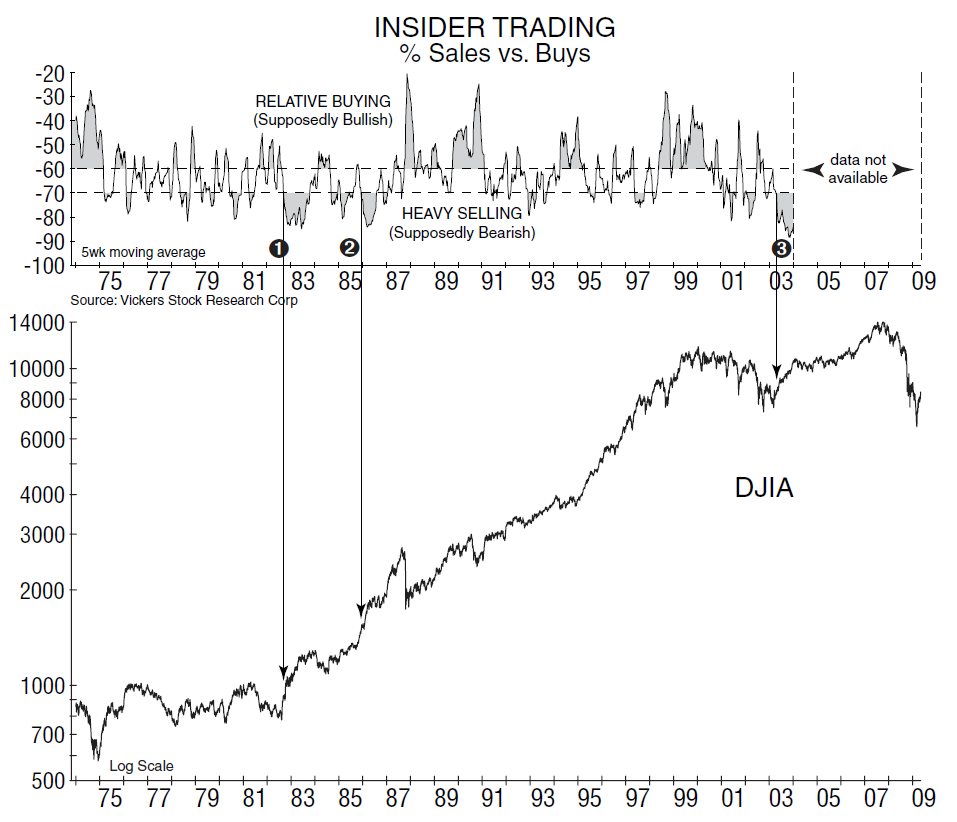
Insiders are already selling – so it must be a bear market rally.
Insider Selling Hits Highest Levels Since Crisis Began
Reuters – 4/27/09
As stocks rebound, corporate insiders ramp up selling
Los Angeles – 4/27/09
Insider Selling Jumps to Highest Level Since 2007
Bloomberg – 4/24/09
To us, this is the worst argument to make, and history clearly supports us! As a group, corporate insiders usually make the worst investors. They often want to buy their stock when the market is falling (before a recession is recognized): i.e., 1973-74, and 1999-2000 at the dot-com peak. And even worse – their heaviest selling in history has occurred after early bull market run-ups in 1982 [1], 1985 [2], and 2003 [3]. So if insiders are heavy sellers today, it’s not on our worry list.
This is only a cyclical bull within a long-term secular bear.
Secular? Cyclical? Forget the semantics. And let’s just focus on the technical facts!

Important Disclosure Information
Past performance may not be indicative of future results. Different types of investments involve varying degrees of risk. Therefore, it should not be assumed that future performance of any specific investment or investment strategy (including the investments and/or investment strategies recommended by InvesTech Research) will be profitable, equal any historical performance level(s), be suitable for your portfolio or individual situation, or prove successful. Read full Disclosures here.
InvesTech Research newsletter published May 8, 2009.
This newsletter is also available to read in PDF format.