
How to use Seasonality to your advantage
Every year sees new debates over the merits of the old Wall Street adage “Sell in May and Go Away.” Unlike many adages on Wall Street, this is more than just a popular saying. It is based on sound statistics that have meaningful investment implications.
Historically, the period from November 1 through April 30 has been the best time to be invested in stocks. The S&P 500 during the winter period has gained an average of +7.2% since 1960 and has delivered a positive return 75% of the time. Conversely, the summer period from May 1 through October 31 has seen an average return of just +2.2%. The results are even more stark when this difference in performance is compounded over time…
A Tale of 2 Seasonal Investors
The graph below compares the performance of two opposing seasonal investors who start with a $10,000 nest egg in 1960. Investor A invests in an S&P 500 index fund from November 1 through April 30 and moves to cash from May through October. Investor B does the opposite, investing only in the summer months and moving to cash for the winter months:
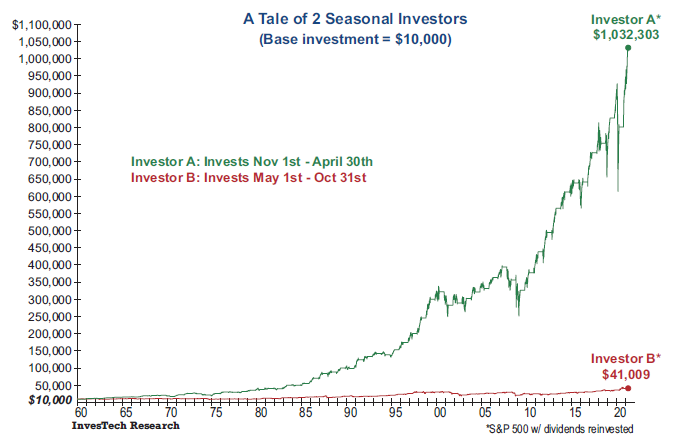
The outcomes couldn’t be more strikingly different! Investor A’s portfolio would have compounded to over $1,000,000,
whereas Investor B’s investment would only have grown to $41,000. While both investors made money, the fact that
Investor A’s portfolio would be worth more than 25 times that of Investor B makes this lesson from history too important
to ignore.
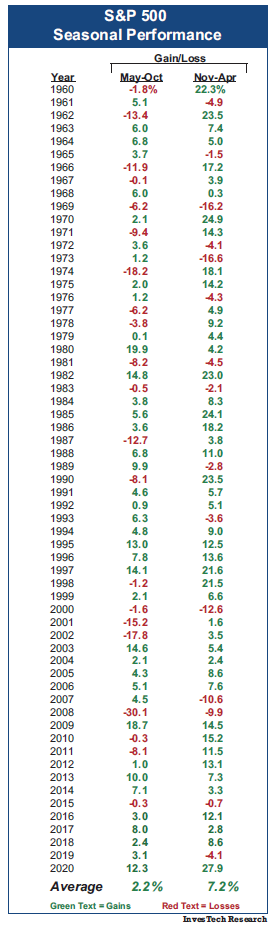
Seasonal Performance
The table at right, which lists the gains and losses for each seasonal period of the past 60 years, further illustrates the substantial difference in seasonal performance.
Note that there are more negative (losing) periods over the summer than during the winter (21 periods versus 15). More importantly, there are nearly twice as many double-digit losses in the summer as in the winter, and such supersized declines have typically been associated with major bear markets, including 1974, 2001-02, and 2008. When looking for double-digit gains, they are far more prevalent in the winter (Nov-Apr) than the summer (May-Oct)… by a ratio of 3 to 1! Simply put, the summer months are not the time to be swinging for the fences.
Although the “Sell in May and Go Away” adage has a very strong historical precedent, abandoning the stock market entirely in May is not a prudent investment strategy. Winters aren’t always winners and summers aren’t always losers – in fact, the majority of summers still see positive gains. Nonetheless, there are ways that investors can use this trend in seasonal performance to their advantage.
Allocation Adjustments
Perhaps the best way to position for seasonality in the stock market is by adjusting one’s allocation based on overall weight of the evidence in managing risk. For example, if one is in a new bull market with very strong macroeconomic and technical indicators, then it might be prudent to ignore the “Sell in May…” phenomenon. The 2009 period was a perfect example, as confirmation emerged that the 2007-09 bear market had likely ended in March. The market subsequently enjoyed a +18.7% gain during the summer months.
Conversely, the May-October intervals in 2001 and 2008 came shortly after long-term bull markets had hit record multi-year highs and were already in retreat. The technical evidence of a bear market was increasing, and a seasoned investor might logically choose to further lighten allocation (i.e., take profits) to weather the seasonally weak summer period in a more defensive stance.
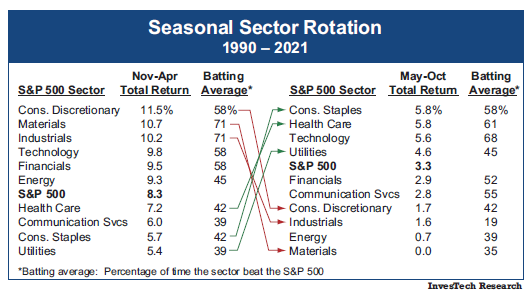
Sector Seasonality
Another strategy to take advantage of this seasonality lies in sector weighting. For instance, the table below shows how the ten S&P 500 sectors performed during the winter versus summer. Included are total returns, as well as batting average (i.e., percentage of time the sector beat the S&P 500 Index). As you’ll note, there is a significant change in sector leadership and performance between the two seasonal periods.
The cyclical sectors such as Consumer Discretionary, Materials, and Industrials tend to lead in the winter months (red arrows), and all three sectors have averaged double digit returns during this period since 1990. The summer months show the opposite trend as investors become more defensive. The cyclical sectors move to the bottom of the list and the winter laggards take the lead (green arrows). Health Care, Consumer Staples, and Utilities have been the most resilient sectors in the summer months, while the Technology sector benefits throughout the year, likely because of its stable cash flows.
As a rational strategy, we do not advocate selling all holdings in cyclical sectors when the summer season starts, however there are some incremental steps you might consider in rebalancing your portfolio…
- Focus on the defensives. Since Consumer Staples and Health Care are the most resilient sectors during the summer, it’s generally a good idea to hold a larger weighting or allocation in these segments heading into May. The average total return (including dividends) for both sectors has exceeded +5% over the summer, and they beat the market about two-thirds of the time. Likewise, the Technology sector also does well. Overweighting these sectors could provide greater protection if the market hits turbulence during this less favorable seasonal period.
- Trim the cyclicals. Conversely, the Consumer Discretionary, Industrials, and Materials sectors show the biggest negative shift heading into the summer period. With average summer returns of less than +2%, these sectors have lagged the S&P 500 the vast majority of the time. Consequently, early spring may be a good time to consider taking some profits and trimming these cyclical holdings if they’ve appreciated over the preceding six months.
Excerpt from InvesTech Research – June 18, 2021
Also available to read in PDF format