
Learn how you can “bear market-proof” your portfolio. You’ll also learn the media “trap” that snares 90% of all investors… why the next bear market could be far more devastating than any we’ve had in over 20 years… how you can safely profit in a bear market… and more.
Bear Markets: The “Bare” Facts
Most investors seldom stop to consider the dramatic impact that a single bear market can have on one’s investment portfolio.
“Bear…Shmear! So what if the market drops 1000 points? I’m in stocks for the long haul, and I’m better off staying fully invested.”
“OK! Bear markets have claws. But if I focus only on undervalued stocks with excellent long-term growth potential, my risks are small.”
“I’m pretty safe in a bear market if I stick with mutual funds. They know how to protect my investment…they’re professionals.”
Such are the dangerous misconceptions often held by investors. Sure, the devastating bear market of 2007-2009 thinned the ranks of traditional buy-and-hold enthusiasts. Yet after the stellar rebound that followed, you still hear investors argue for a buy-and-hold strategy, based on the high-performance decades of the 1980s and 1990s.
Since 1929, we’ve experienced a bear market about every 4-6 years. The average decline of these bear markets, as shown in the following table, has been almost -35% (without 1929).
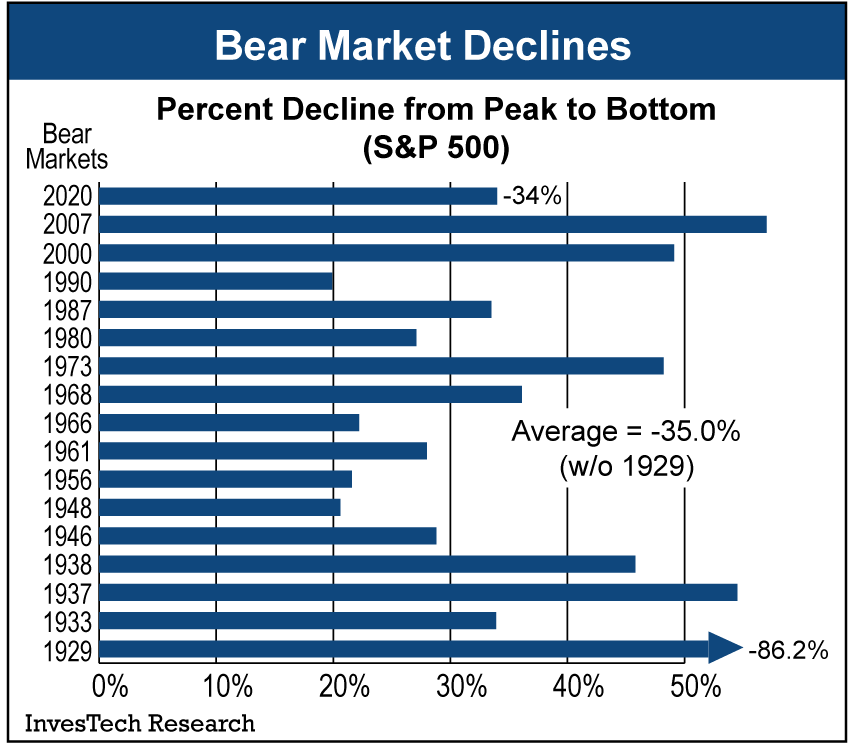
The damage, however, can be far worse if one is invested in popular momentum stocks at the market’s peak. For instance, the technology-focused Nasdaq Index lost a heart-stopping -78% in the 2000-2002 bear market. And the S&P 500 Financials Index lost -82.6% during the Financial Crisis of 2007-2008.
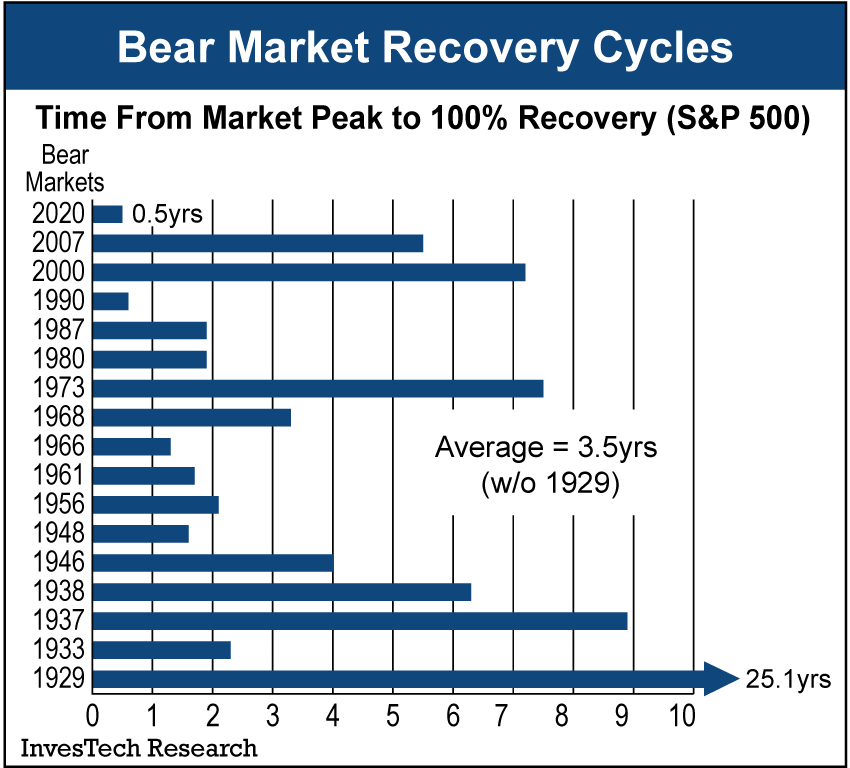
What about holding on through a “typical” bear market? The table at left provides a bear-by-bear summary of just how long it takes for investors to recover their losses.
The average length of a bear market for the S&P 500 is 1.4 years. And the average recovery cycle for a bear market is over 3½ years (without 1929)!
Even at an average recovery time of 3.5 years, an investor may see little harm in riding through an occasional bear market. The table below gives a historic look back at a 20-year period where bear markets occurred at more regular intervals and highlights the difference a few “bears” can have on four historically stodgy blue chip stocks: General Motors, IBM, Xerox, and Sears.
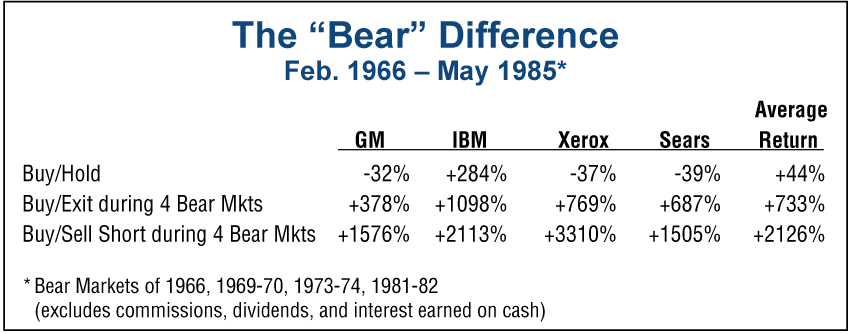
In the first case, each stock was purchased and held for a 20-year period with an average total return of only +44%. However, in the second case, if this hypothetical investor was shrewd enough to exit the stocks during just four bear markets, the return jumped by over 15 times to +700%. The stunning difference becomes even more pronounced in the third case where our hypothetical investor sold short during the bear markets and averaged a whopping +2126% gain! While this 50-fold increase in return isn’t attainable in the real world, it does reveal the critical importance of protecting one’s portfolio.
There have been volumes of information written about the magic of compound interest, but few have stopped to look at the dark side of compound interest. That is, the dramatic impact that a single bear market can have on one’s investment return…

The table above examines how a 20% compound gain over 5 years would turn an initial $10,000 investment into $24,883. Yet, if just one of those years was spent riding through a mild bear market with a -30% loss, the final gain would be cut by nearly half. And if that bear market turned out to be severe with a -60% loss… then ALL profits were lost plus part of the original investment!
Another illustration of the damaging power of reverse compounding is shown at right, which reveals how much an investor must gain back –or recapture– after suffering through a bear market. After experiencing a -20% loss, an investor must gain +25% to get back to even. However, as losses become more extreme, so does the reverse compounding. With a -50% loss –such as that experienced during the recent 2007-2009 bear market– an investor needs to make back +100% just to recapture their original investment.
As shown previously, markets don’t recover from bear markets quickly. Instead, it can take months or even years of new bull market gains before an investor recoups losses experienced in a bear market.

Hence, minimizing losses in a bear market is critical to the long-term success of an investor’s portfolio.
But mutual funds –under the direction of professional money managers– provide a safe alternative for avoiding the devastation of a bear market, right? Wrong! A quick look at losses in some of the largest diversified equity funds during the 2007-2009 bear market should dispel this myth: Janus Fund down -51.5%, Fidelity Magellan down -60.4%, and Vanguard Windsor down -60.4%
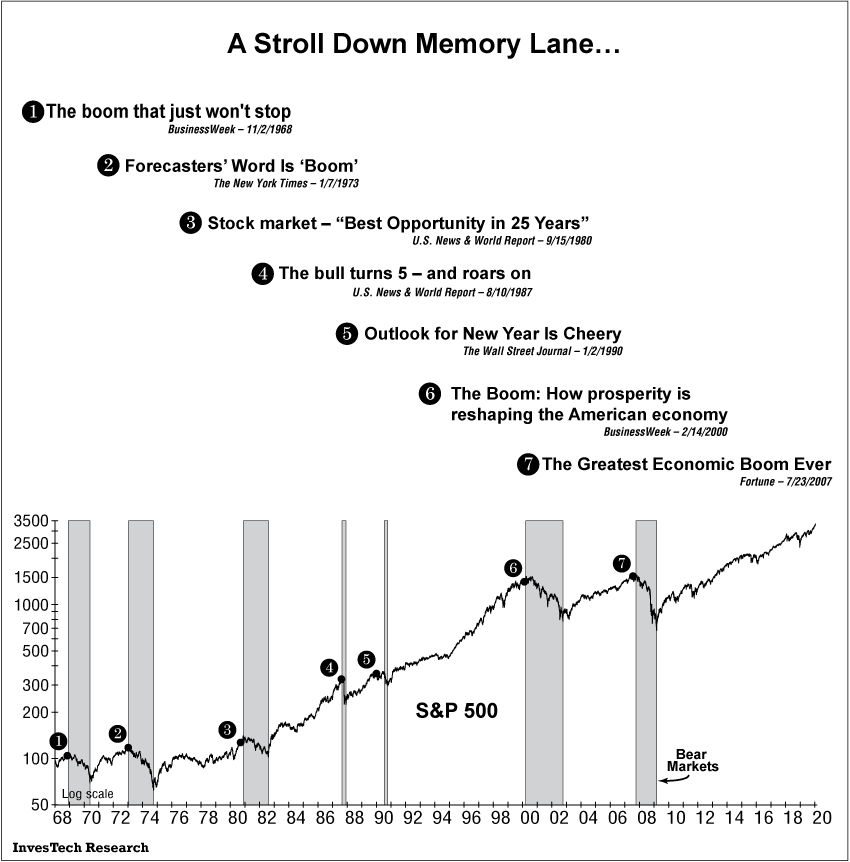
Still, many investors believe that they can stay on top of the stock market just by watching for the inevitable signals of an economic downturn – and that media headlines and news articles will provide ample warning that a bear market lies ahead. History, however, shows otherwise. For those who actually believe they don’t need technical or monetary analysis to see the next bear market in advance, the following graph takes “A Stroll Down Memory Lane” with some of the most respected, reliable, and objective media sources available, including BusinessWeek, The New York Times, U.S. News & World Report, The Wall Street Journal, and Fortune…
Bottom line: The most successful investors are not necessarily right all the time. They aren’t always in the hottest stocks. They don’t catch every advance by trying to time the market at every twist and turn. But they do manage risk in order to avoid suffering any major losses. Because they know that preserving one’s portfolio (and profits) through a severe bear market can make the difference between achieving their investment goals or financial disaster.
This report is also available to read in PDF format.