
An Invaluable Tool for Identifying “Best Buy” Opportunities
History of the Coppock Guide
Developed over 60 years ago by Edwin S. Coppock, the Coppock Guide has proven to be one the best tools for identifying long-term buying opportunities. It’s been modified and adapted by a few analysts since then, but the only notable publicity it receives comes from an occasional mention in Barron’s or from independent, technically-oriented newsletters. Yet this indicator has a remarkable 100+ year track record when it comes to signaling the start of a new bull market for stocks. And it is one of the few technical tools that would have kept anxious investors from stepping prematurely into the middle of the 1929-1932 record stock market decline.
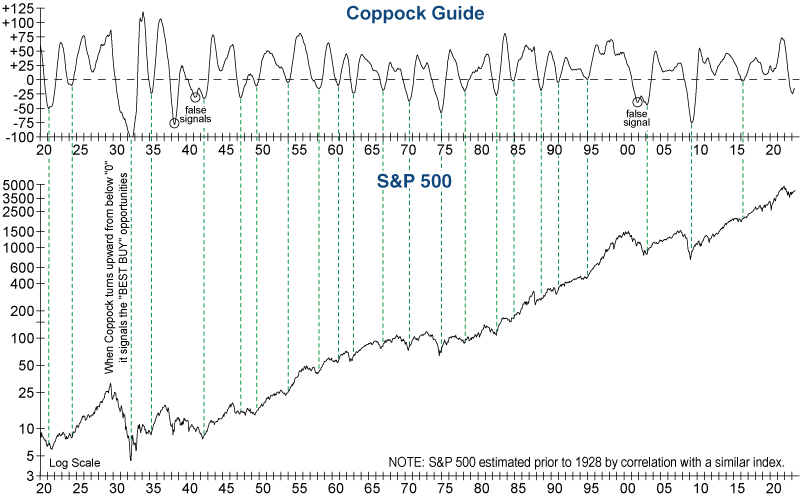
The Coppock Guide is often described as a “barometer of the market’s emotional state,” as it tracks the ebb and flow of equity markets from one psychological extreme to another. Its historical value lies in signaling or confirming the best, low-risk buying opportunities. All of these are noted by the dashed lines on the graph below.
From a technical perspective, the Coppock Guide is known as a momentum oscillator. It is calculated by taking the 10-month weighted moving total of the 14-month rate of change plus the 11-month rate of change of a market index. As a result, it reverses direction when momentum or rate of change in the market peaks. And because market bottoms are usually sudden or “spiked” reversals, this indicator works amazingly well in triggering buy signals.
How to use the Coppock Guide
Coppock Guide buy signals are marked by upturns of two or more points from readings at or below zero. And often the more negative the reading when it turns upward, the more impressive the profits ahead. Using these guidelines has confirmed practically every major bull market run since 1920, with just three false signals given (in 1938, 1941, and November 2001) when the Coppock Guide turned upward before the bear market had reached bottom.
An example from recent history
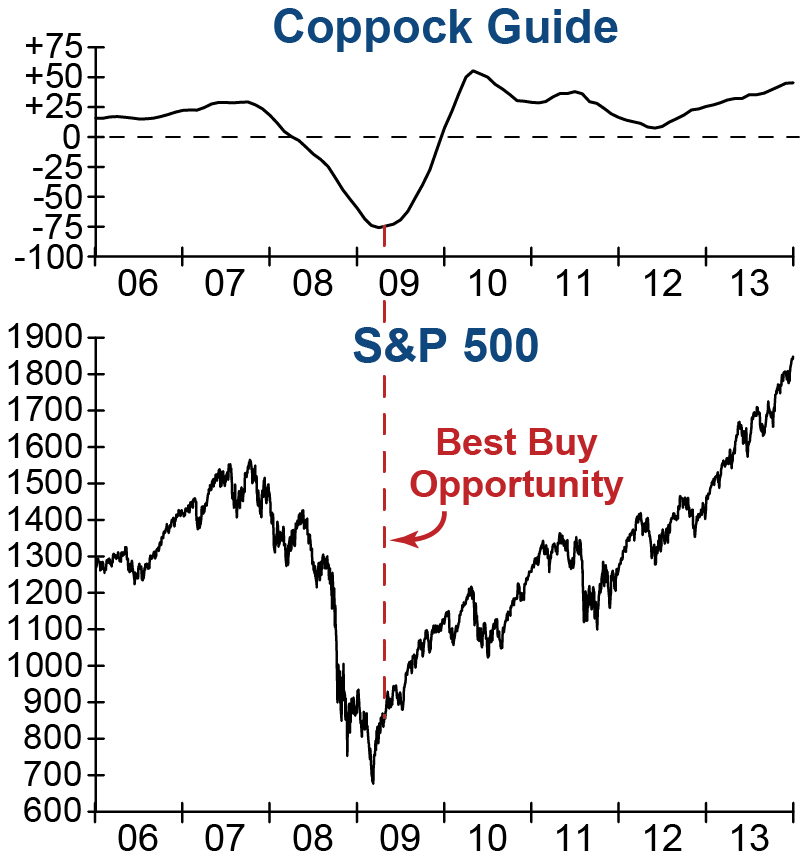
The most recent generational buy signal given by the Coppock Guide occurred in 2009, shortly after the bear market low. Rock-bottom investor sentiment took this Index to the lowest reading in 70 years, suggesting that a tremendous buying opportunity was just around the corner. As a result, we acted quickly on the subsequent upturn in this tool by increasing our invested allocation from 56% to 97% in the three months following the bear market bottom. As we stated at that time: “With the Coppock Guide triggering a BUY signal in May, all blocks have now fallen into place to confirm this is a new bull market, and not a bear market rally or trap as widely feared.”
Watch out for “Killer Waves”
While the Coppock Guide is renowned for its reliable buy signals, it has never been known for timely sell signals. The reason is that market tops are usually slow, rounding formations in which momentum (and the Coppock) peak up to a year or more ahead of the market. So other technical and monetary tools must be used to gauge when to reduce exposure and shift to a higher cash reserve… except in a few cases. And that’s where the carnage comes in…
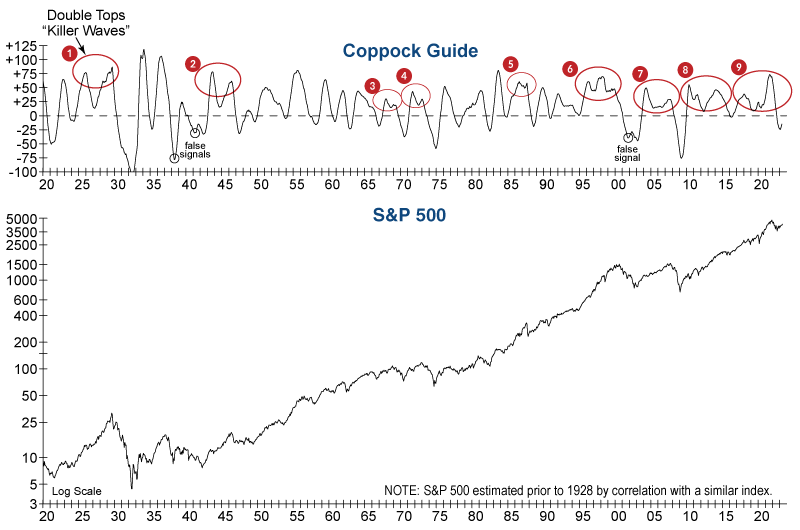
In the late 1960s, a technician named Don Hahn observed another phenomenon about the Coppock Guide. When a double top occurs without the Coppock falling to 0, it signals a bull market that hasn’t undergone any normal, healthy washouts or corrections. That’s a runaway bull market usually headed for disaster. As a result, these dangerous double tops are known as “Killer Waves.” While they have only occurred 9 times in the past 102 years, 5 of them accompanied the beginnings of the most notorious bear markets of the past century: 1929, 1969, 1973, 2000, and 2007.
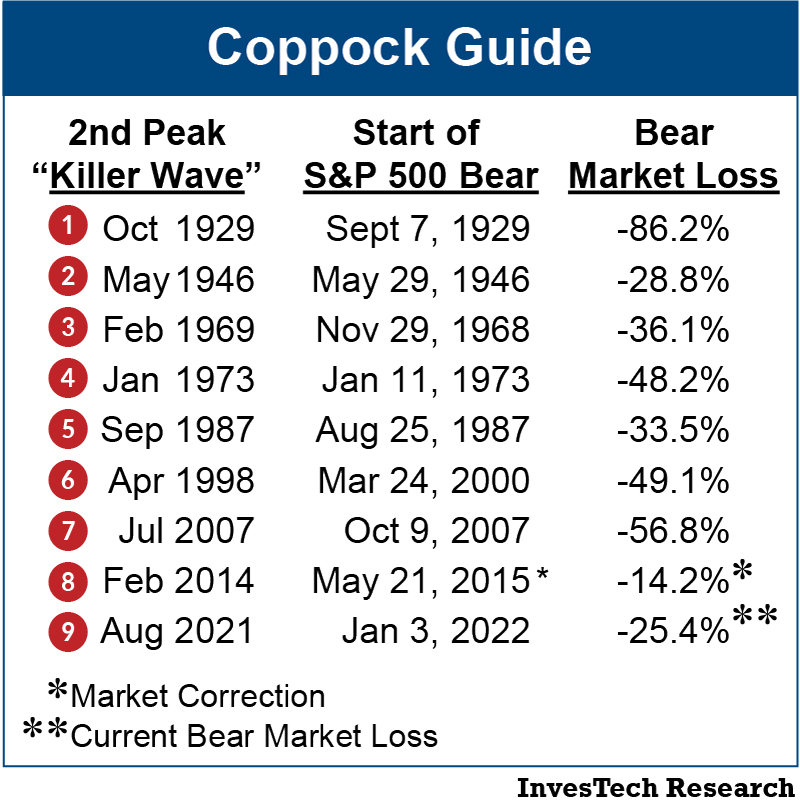
The most important historical takeaway from these double tops is that they can result in nasty bears! Looking at the 9 “Killer Waves” of the past century, the table above shows that all but one ended with significant bear market losses. The average decline following these signals (excluding the -86% loss in 1929) has been nearly -40%… revealing why they are so aptly called “Killer Waves.”
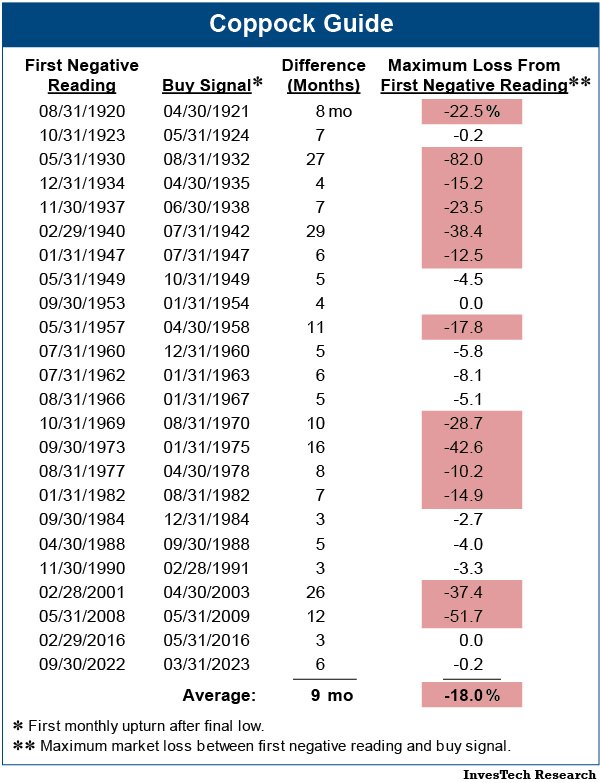
The value of patience (and the cost of being overly eager)
The Coppock Guide clearly has a remarkable track record, yet patience is key to getting the most out of this tool. Some investors may be tempted to start buying before the Coppock’s upturn, however, this can have disastrous consequences as shown in the table at right. On average it takes 9 months for the Coppock Guide to register a buy signal after its first negative reading, and the market suffers an average maximum loss of -18% over this period. This is a serious (and unnecessary) price to pay for those who try to anticipate a market bottom rather than wait for an official Coppock Guide upturn.
With its remarkable track record, the Coppock Guide should be a key tool in any investment strategy. When used with our other indicators, it can provide the discipline and patience to avoid treacherous bear market rallies and wait for the best buying opportunities that occur only a couple times each decade.
Also available to read in PDF format.