
Margin Debt is an often-overlooked tool that has historically been among the most useful for monitoring leverage and excesses in the stock market. It represents the amount of money borrowed by investors to buy stocks on margin, and it has mattered historically for two reasons:
- It is a measurable indication of the public’s appetite for risk and the degree of speculation in the equity market.
- It represents “hot money” – or the funds that will head for the exit quickly at the earliest sign of trouble or when margin calls hit and leveraged positions must be sold.
As a result, Margin Debt measures more than just borrowed money, it reflects psychology.
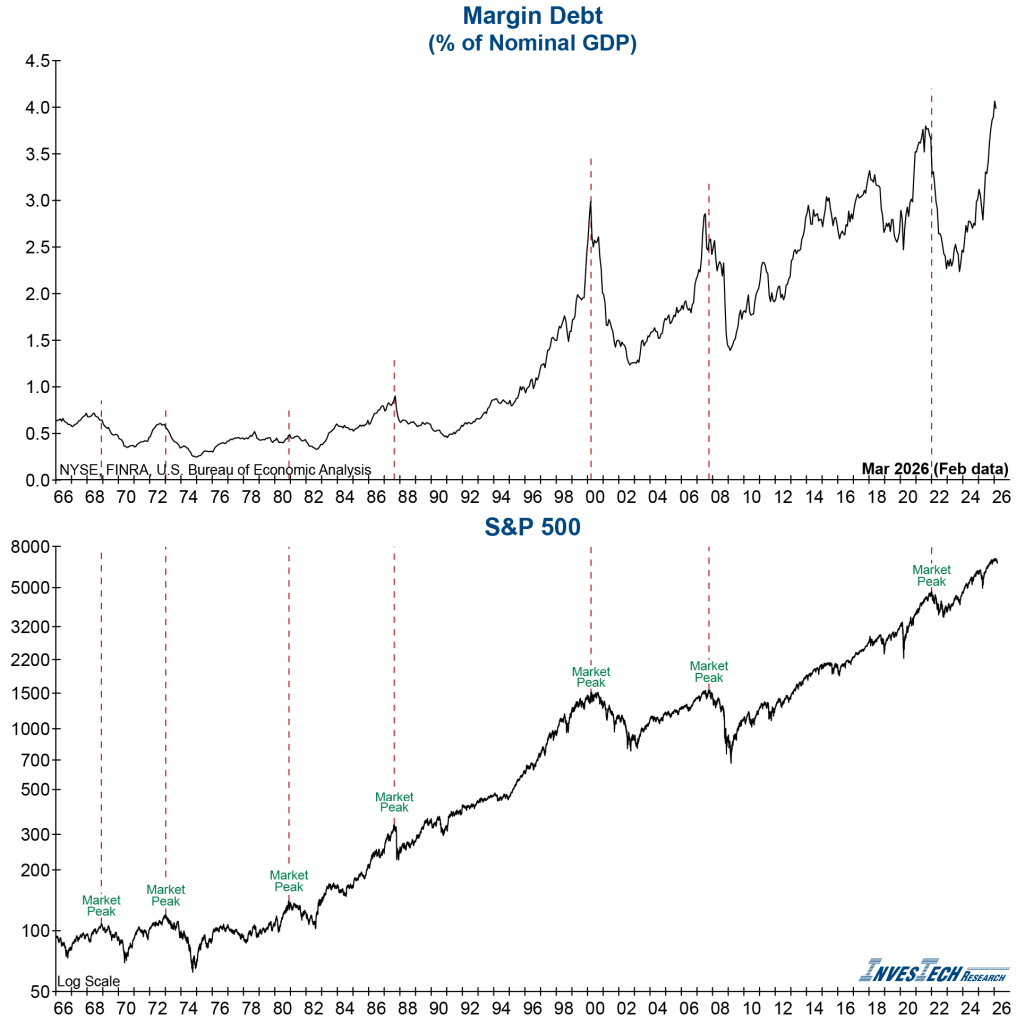
We track Margin Debt as a percentage of nominal GDP to put the figure in historical perspective. Downturns in this measure following a parabolic rise often precede or coincide with peaks in the stock market.
Remember: Margin Debt is inherently lagging by 1-2 months. It is generally released around the 20th of each month for the previous month, and consequently you’re looking in a rear-view mirror – albeit a very near one.
Is a Major Reversal Coming?
Margin Debt as a percentage of nominal GDP recently hit an all-time record high – far exceeding the peaks prior to the 2000 Tech Bubble Washout and the 2007-09 Great Financial Crisis. That means leverage (and investor psychology) sit at a historic extreme.
We believe Margin Debt could take a major plunge in the coming months as leveraged hot money starts to head for the exit. If it does, that would confirm a bull market top is most likely in place.