
“The fact is that markets behave in ways, sometimes for a very long stretch, that are not linked to value. Sooner or later, though, value counts.”
Warren Buffett
Lengthy bull markets or those that incite investor frenzy with promises of new “game changing” technology can drive stocks to extremes that are supported merely by hype and the promise of future gains. When this occurs, prices become disconnected from company fundamentals, creating an overvalued market that can last for months or even years.
While high valuations don’t cause bear markets and seldom matter in the near term, they have vital implications for the long-term health and safety of your portfolio. They should be viewed as a barometer of risk, that represents your margin of safety as an investor. The more severe the overvaluation, the greater the potential downside should corporate projections disappoint and major indexes turn south.
The stock market today trades at one of the most expensive levels in history, which poses a major challenge to investors. Extremely overvalued markets are historically never resolved with fundamentals “catching up” to inflated stock prices. A washout is typically necessary to reverse the excesses. At the end of the storm, however, a generational buying opportunity always emerges for those whose portfolios survive the reset. Below we present a number of valuation metrics that can help gauge overall market risk today.
The Price-to-Earnings Ratio – An Old “Tried & (almost) True” Favorite
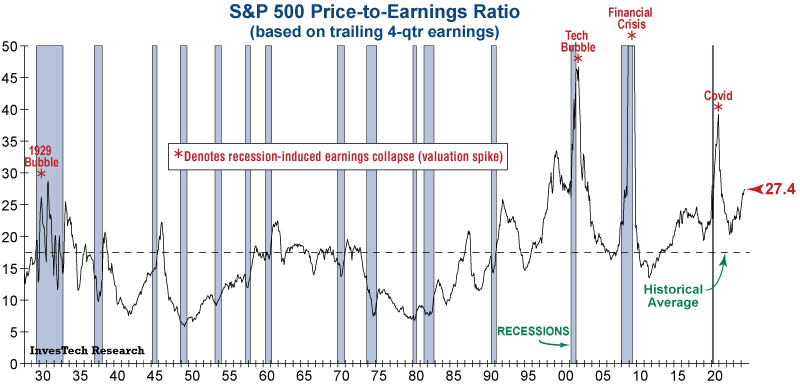
Perhaps the most commonly used –and at times most distorted– valuation metric for the stock market is the S&P 500 Price-to-Earnings (P/E) ratio. One of the more popular calculations for P/E relies on “forward-looking” earnings, which make stock prices appear reasonable near market peaks. That inherently gives a false sense of security to unsuspecting investors at some of the most dangerous times. Of course, when a recession hits, those forward-looking earnings disappear as companies struggle to maintain sales.
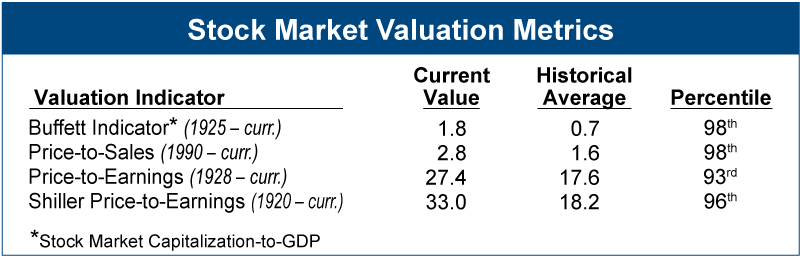
For this reason, we prefer to use trailing earnings, which have already been reported. What is most notable on the graph below is that outside of recession-related spikes in P/E caused by collapsing earnings (marked with red asterisks), today’s lofty S&P 500 Price-to-Earnings ratio (27.4) is only matched by the Tech Bubble of the late 1990s.
Shiller CAPE – An Improved Historical Perspective
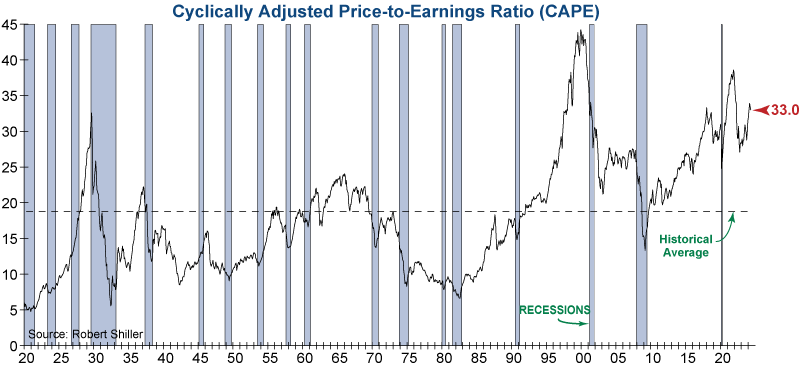
A better way of looking at P/E ratios, popularized by well-known economist Robert Shiller, is the Cyclically Adjusted Price-to-Earnings ratio (CAPE). This uses a 10-year average of real (inflation-adjusted) earnings instead of trailing twelve months or four-quarters, which smooths out many of the major swings in earnings caused by extreme fluctuations in the business cycle. CAPE tends to be a more useful long-term measure of P/E because of this smoothing. The current CAPE ratio is 33.0 (see graph below), which is historically high and demonstrates the extreme priciness of today’s market.
The Price-to-Sales Ratio – Less Distortion (but shorter history)
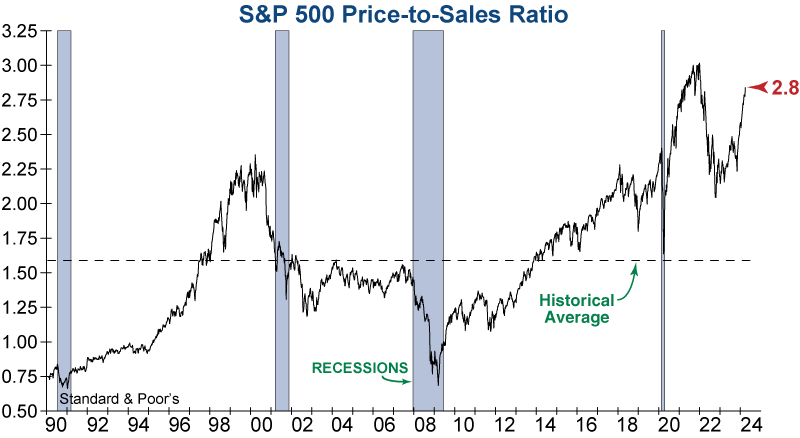
Outside of P/E, there are other helpful valuation methods that are not earnings-based. One of these is the Price-to-Sales (P/S) ratio, which is calculated for the S&P 500 by taking the ratio of the Index price (market capitalization) to total sales of all component stocks over the past 12 months.
The P/S ratio is effective as a valuation indicator because, unlike earnings, sales are less subject to accounting adjustments or manipulations, making it particularly reliable. The current P/S ratio for the S&P 500 Index is 2.8, which is one of its highest readings since 1990 and is almost 80% above its long-term average.
Stock Market Capitalization-to-GDP – The Buffett Indicator
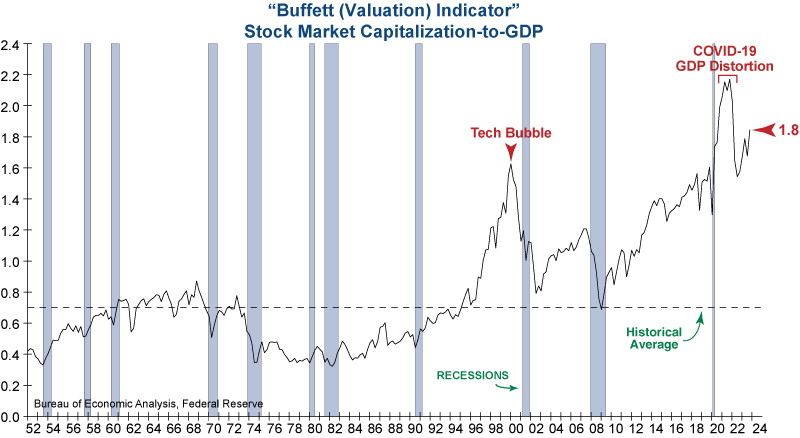
Stock Market Capitalization-to-GDP, commonly known as the Buffett Indicator, was brought to the attention of mainstream media by Warren Buffett in 2001 when he suggested that it was the “best single measure of where valuations stand at any given moment.” This ratio compares total stock market capitalization and nominal quarterly GDP to indicate whether or not stocks are moving in line with economic reality. According to Buffett, anything above 1.0 is considered overvalued.
This is problematic for today’s market, as the Buffett Indicator is now at 1.8 and is more than 150% above its long-term average. For perspective, today’s stock market would have to decline more than -50% to get close to its historical average valuation.
Today’s Stock Market – A Historical Valuation Comparison
There is no single perfect way to determine how richly priced the stock market is at any point in time. Each of the metrics reviewed above has its drawbacks, and some may even be vulnerable to creative manipulations, such as dropping companies with negative earnings when calculating an Index P/E. Taken in aggregate, however, they can give a reliable picture of the risk currently confronting investors.
No matter how you slice it, the stock market is expensive today. In fact, by most of the measures shown in the table below, the stock market has been more overvalued less than 4% of the time!
Yet despite the overvaluation in the S&P 500, which is dominated by large-cap stocks, there are areas of the market that remain relatively attractive, particularly in the more defensive sectors. The challenge for investors is strategically managing risk to not only grow capital but also protect it in a downturn by focusing on these pockets of value.
Seeking Safety in a High-Risk Market – The Value Proposition
Not all sectors, industries, and stocks carry the same level of risk. To illustrate, let’s step back to the late 1990s, which was also a period of excessive speculation and high valuation. The graph below shows how different areas of the market performed in the years after the bursting of the Tech Bubble in 2000.
The S&P 500 Growth Index is comprised of S&P 500 stocks that exhibit the highest sales growth, ratio of earnings changes to price, and momentum, while the S&P 500 Value Index tracks the stocks with the lowest ratios of price to book value, earnings, and sales. The Internet Index, which represented the most speculative issues in the market at that time, had tremendous performance during the stock market mania through 1999.
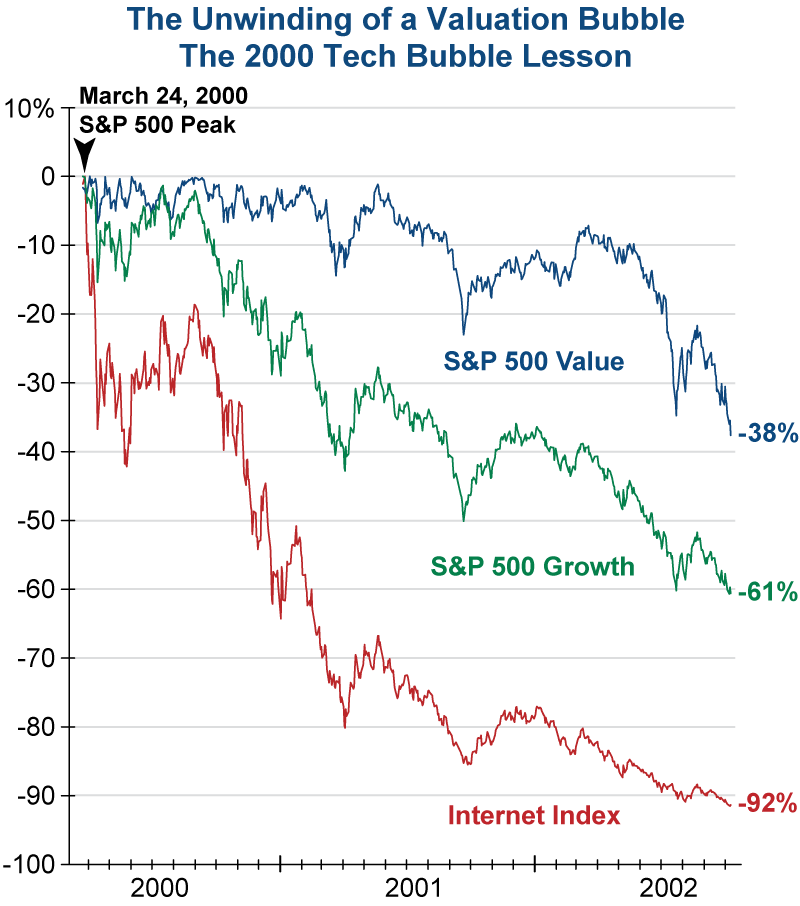
When investor psychology started to unwind following the S&P 500 peak in early 2000, the Internet Index lost -36% in just three weeks and went on to lose over -90% by the end of the bear market. The S&P 500 Growth Index also contained many overvalued and speculative stocks, but to a lesser degree than the Internet Index. Growth stocks started to lose significant ground in the second leg of the 2000-02 bear market and ended up with a maximum loss of over -60%.
The S&P 500 Value Index remained unloved in the final years of the Tech bubble with only modest gains, but this meant that it had far fewer extremes that needed to be unwound when the bear market finally appeared. As a result, these value stocks were relatively resilient until the final leg of the bear market (often referred to as the “capitulation” phase) in 2002.
The Lessons Learned
There are obviously lessons to be learned from such overvalued environments:
- In any major bear market, almost all stocks fall in price, but the objective is to minimize your losses and focus on value. This is one of the most prudent and defensive strategies to implement, and it facilitates an early recovery.
- Avoid hyped-up and speculative stocks that take the lead in these overpriced periods.
- Growth stocks typically suffer more than value stocks in any big downturn. Reduce investment in stocks that are trading with excessive valuations and price momentum and focus your attention on equities at favorable relative levels offering a greater margin of safety.
By practicing a “safety-first” investment strategy, investors can participate in bull market gains while also allowing more time to make defensive adjustments as bear market warning flags begin to appear. The ultimate goal is to manage risk in a way that not only weathers the storm, but maximizes capital so your portfolio is prepared to take advantage of the next best buy opportunity when it inevitably arrives.