
The Indexing Craze
The indexing craze… it’s sure to be remembered as a hallmark of the 1990s! What has made investing in the S&P 500 so popular these days? If you buy into a recent Business Week article, “Index funds are cheap, easy–and they’re changing the way Americans invest.” A value investor might disagree, since index funds are holding a group of stocks which are at their most overvalued levels in history. However, in a sense, they are “cheap”… you don’t have to pay a fund manager to search for attractive stocks, and there are few transaction fees when the portfolio doesn’t change much from year to year. As for “easy,” that’s a different story. Our October 23, 1998 issue of the InvesTech Mutual Fund Advisor devoted considerable space to dispelling some of the myths of easy profits and safety that enthusiasts claim for these funds.
Saving for Retirement Index Fever
Fortune, 11/9/98
Who Needs a Money Manager?
Business Week, 2/22/99
The popularity of investing in a large-cap index is a phenomenon of long-running bull markets, especially in the latter stages like today. There are several reasons for this. After years of positive gains in the stock market, new investors latch on to the implied idea that making money is simple. It’s also assumed that index funds are safer than other mutual funds because many S&P 500 stocks have widely recognized names. And finally, index funds are the obvious choice for novice investors who tend to be drawn in during late stage bull markets. [Just try to talk a non-investor into putting money into the stock market in the depths of a recession when bull markets are typically born!] During the longest running bull markets, like today, index funds appear attractive even to more experienced investors, simply because that’s when they outperform other funds.
Historical Perspective
They may be at the height of popularity now, but index funds aren’t just a phenomenon of the 1990’s. If you were investing in 1975 you would have seen this announcement in U.S. News & World Report:
INVEST IN THE STOCK-MARKET AVERAGE?
A new investment vehicle -the “index mutual fund”- is making a big pitch for some of the billions that pension funds, college endowments and other institutions invest in the stock market.
For most of the big institutional investors, just keeping up with the general stock-market averages would present a large improvement over their performances in past years
U.S. News & World Report, 12/29/75
Index funds were a hot new concept in 1975, just in time to dramatically UNDERperform the majority of stocks. Over the next seven years, the smallest 20% of NYSE issues outperformed the S&P 500 by more than 5-fold (752% versus 150%). After this less-than-spectacular start, the popularity of index funds came and went with the market cycles for the next decade. They really started to proliferate only when the current bull market turned into a large-cap bonanza beginning in 1994.
Last year, index funds attracted nearly 19% of all money invested in mutual funds. And Vanguard Index 500 with $74 billion is close to passing #1 Fidelity Magellan in net assets. But that’s just the tip of the iceberg, as the majority of mutual funds are now investing in the “big 50 ” –the 50 largest-cap stocks in the S&P 500– simply to keep pace with that index’s momentum. This flow of money into a handful of large stocks affects not only the market averages, but it can have long-term repercussions for the market as well as your future investment strategy.
The Impact
Here’s the current, and potential, impact as we see it…
Investor psychology is distorted.
Many novices view index funds as a type of variable rate CD. In Canada, one of our readers reports roadside billboards are promoting a guaranteed principle type of market index investment over GICs (the Canadian equivalent of a CD). What happens when index funds fail to return that expected 11%, or worse, when a major bear market wipes out 40-50%. Someone’s going to be left holding the bag.
More and more “non-index” funds are actually indexing a large part of their portfolios.
As index funds have been the only ones to keep pace with market averages in recent years, the natural reaction is for fund managers to change strategy. The philosophy seems to be, “If I can’t outperform the market, at least try to imitate it.” The result is an increasing number of equity funds that look like mini-index fund clones as managers are dragged into the same stocks. Any fund wanting to match or beat the averages must hold at least some of the “big 50 ” of the S&P 500. To make this point, we looked at the portfolios of the ten top performing “non-index” growth funds for the past 12 months. On Average, 5 of the top 10 holdings in each portfolio are among the 20 largest stocks in the S&P.
As an example, take the Fidelity Dividend Growth fund which, by its very name, seems to imply conservative growth with a focus on dividends. But there’s nothing conservative about an annual portfolio turnover rate exceeding 105% for each of the last 5 years. And its dividend yield is only 0.4% – less than one-third the dismal yield of the S&P 500.
Investments in momentum related funds are funneling into the most overvalued stocks in the market, driving them even higher.
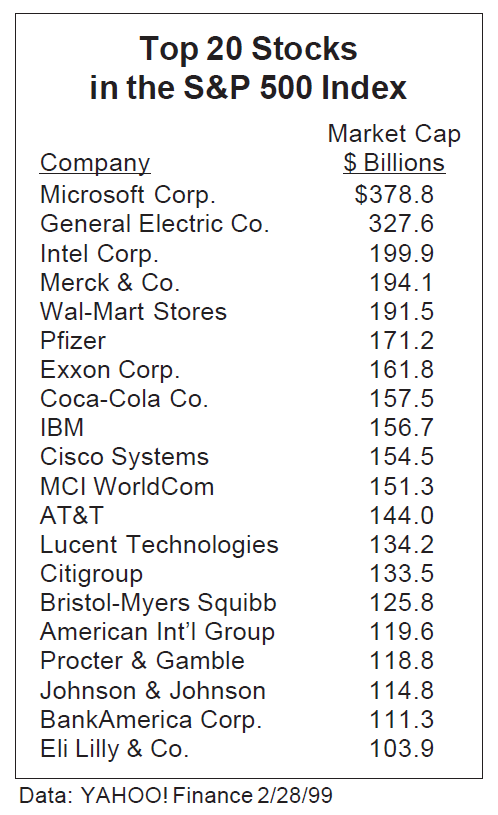
Remember, the S&P 500 is a capitalization weighted index, so money going into index funds is not evenly distributed in all 500 stocks. Only fifty stocks account for 55% of S&P 500 capitalization and 55% of an index fund portfolio. That leaves the other 450 stocks to split the rest. Indexing contributes to explosive run-up and overvaluation in these top 50 stocks. Microsoft today is valued at 1.4 times the total capitalization of GE, Intel, Merck, Wal-Mart, Pfizer, Exxon, Coca-Cola, IBM, Cisco, AND Microsoft in December of 1990 at the start of this bull market. And America Online, which has yet to show any significant earnings, is now valued at more than ANY of the ten largest companies in the U.S. in 1990!
Market volatility increases whenever interest narrows to just a few stocks.
All eyes are on the same select group (the largest companies in the S&P 500). Any news or earnings surprises can cause wild gyrations in price as funds scramble to dump or pile into hot movers. No wonder the intraday volatility in 1999 is running the highest for any bull market year since 1929!
Finally, indexing amplifies the technical distortion in the markets.
The current issue of the InvesTech Market Analyst takes an insightful look at what’s really happening in breadth and other technical divergences. With support from the “big-50″ stocks of the S&P, the closely watched indexes like the DJIA and NASDAQ simply don’t reflect these divergences. For a broader view of the market, take a close look at the Russell 2000 Index (premier small cap index) or the Value-Line Composite Index (an equally weighted index of 1700 stocks).
Investment Strategy
First, we advise that you examine the individual stock holdings in any mutual fund you own – especially for any funds that have “performed” well over the last couple years. Ask yourself, “How ‘indexed’ is this fund?” We’ve listed the 20 largest cap stocks of the S&P 500 in the table shown at left. If you find more than 3 or 4 of these stocks in the top 20 portfolio holdings of your fund, then take heed – your fund is nibbling on indexing.
In addition, avoid judging a future fund by its 1997-98 performance. If a fund was near the top of the performance list for these past two years, chances are it was momentum investing. Blue chip stocks are often the last to peak in a long-running bull market, benefiting from a “flight to safety” as other stocks falter. Unfortunately, when they fall from overvalued heights, they can be the last to recover from a recession.
This past bull market illustrates our point. Index funds have enjoyed the run up in blue chip stocks, handily beating most actively managed funds over the last few years. Since 1994, the Vanguard 500 Index Fund has more than doubled the total return of the average small stock fund, and provided 1.6 times the return of the average value fund. This performance may seem unbeatable, but it’s only part of the story.
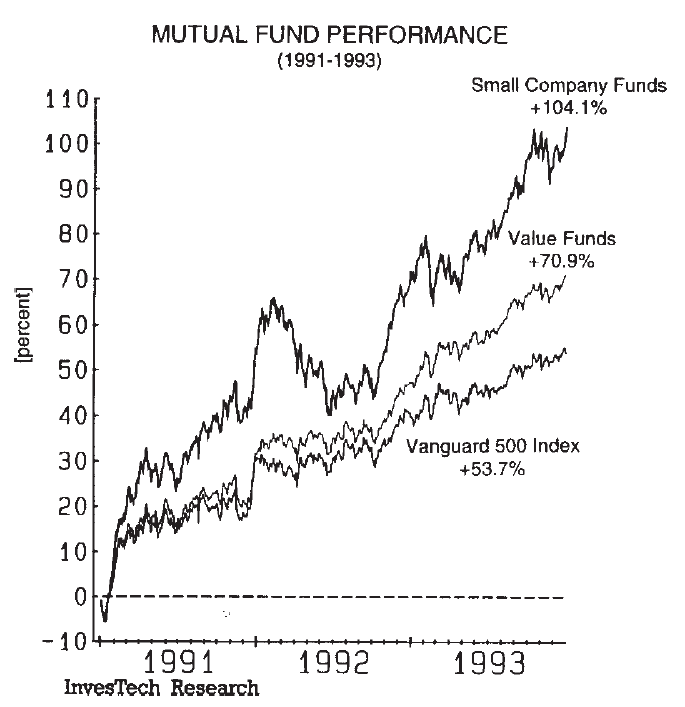
This “Mutual Fund Performance” graph from 1991-93 reveals the comparative performance of the Vanguard 500 during the first three years of this bull market… the safest years to be invested. Note that the average “value” fund outperformed by a factor of 1.4… and the average small company fund literally doubled the return of the Vanguard 500 Index fund.
From the perspective of risk management now (and future profits later), it’s never been more critical to know your mutual fund or prospective mutual fund. We firmly believe the big-cap leaders of today will again become the laggards after the next bear market washout. If that is the case, then you don’t want to find your portfolio indexed to under-performance at what may become one of the best buying opportunities of our lifetime.
InvesTech Research newsletter originally published March 12, 1999
This newsletter is also available to read in PDF format.