
In recent weeks, as our speculative InvesTech AI Index soared to new highs, the market has sent a concerning message along a number of important technical and monetary fronts.
Our InvesTech AI Index has gone “parabolic”!
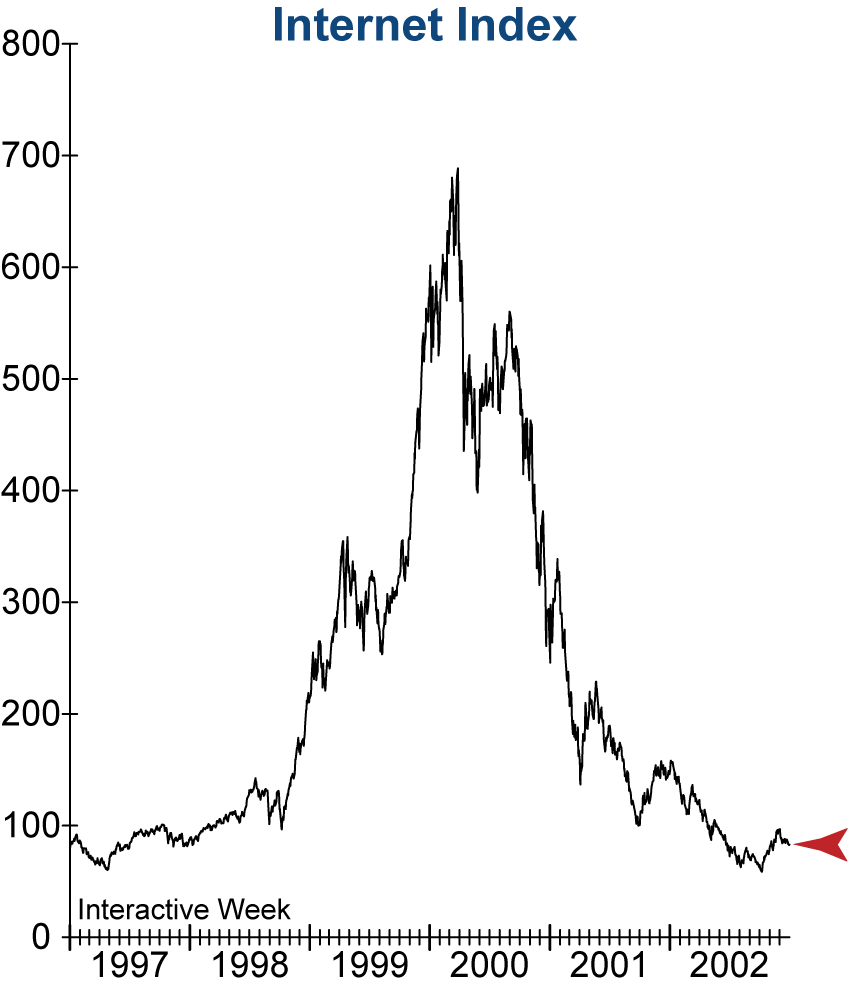
The exuberance-tracking AI Index (shown below) is a crucial measure of investor hype in AI technology. When a new technology enters the market, it is not unusual for investors to get (over)excited and for stock prices to shoot to the moon. But we know from history that stocks don’t stay there long and often fall back to earth hard and fast – almost always taking the broader market down with them. We saw a taste of this when the AI Index broke prior to the stock market’s sharp sell-off earlier this year.
An important example of this is the Internet and dot-com stocks in the late 1990s. While the technology certainly changes over time, human emotions and investor psychology do not. It’s important to remember that this can happen even when the technology succeeds – just as it did with the internet.

The tech-heavy Nasdaq just triggered the most severe 1-day divergence in 54 years!
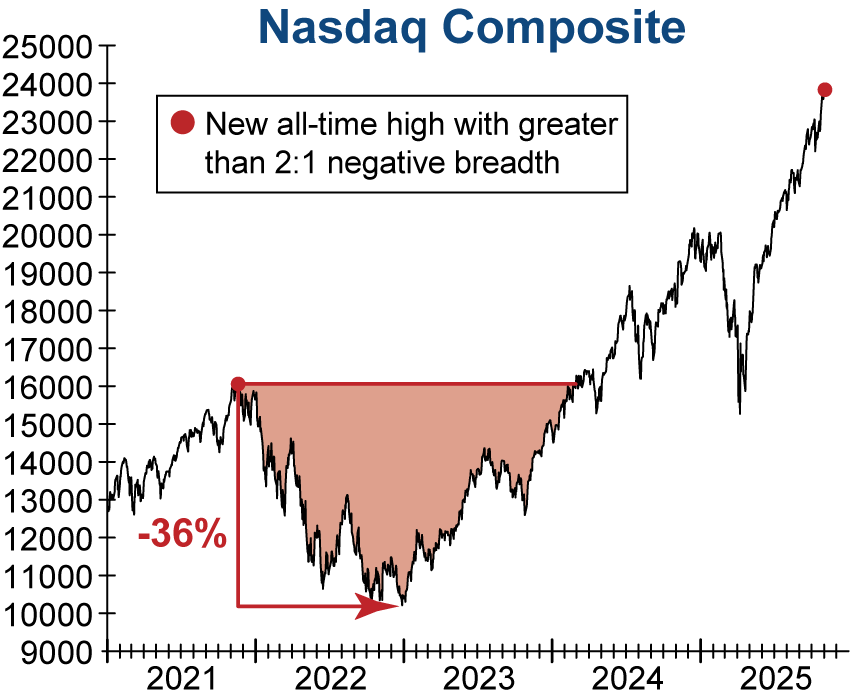
As detailed in our Market Insight last week, the Nasdaq Composite hit a new all-time high, when on the same day twice as many stocks were declining as those advancing. This severe breadth divergence has happened twice in its 54-year history.
The only other occurrence was on November 18, 2021 – just before the Index peaked and started tumbling. The subsequent bear market that followed saw the Nasdaq suffer a decline of -36% over the next 13 months and required over 2 years for the Composite to hit new highs again. This doesn’t guarantee an imminent fall in the stock market ahead, yet it is a warning one cannot ignore.
Broader market breadth is also reflecting the Nasdaq warning.
Market participation is narrowing significantly across the board. InvesTech’s A/D Divergence Index measures what the S&P 500 Index should hypothetically be trading for given the trend in breadth, versus where the Index is actually trading (adjusting for the effects of decimalization), making it an essential tracker of stock market breadth. When the A/D Divergence Index is in a steep decline, it means that breadth is not supportive of the S&P 500’s performance and signals that the market is vulnerable to a downturn.
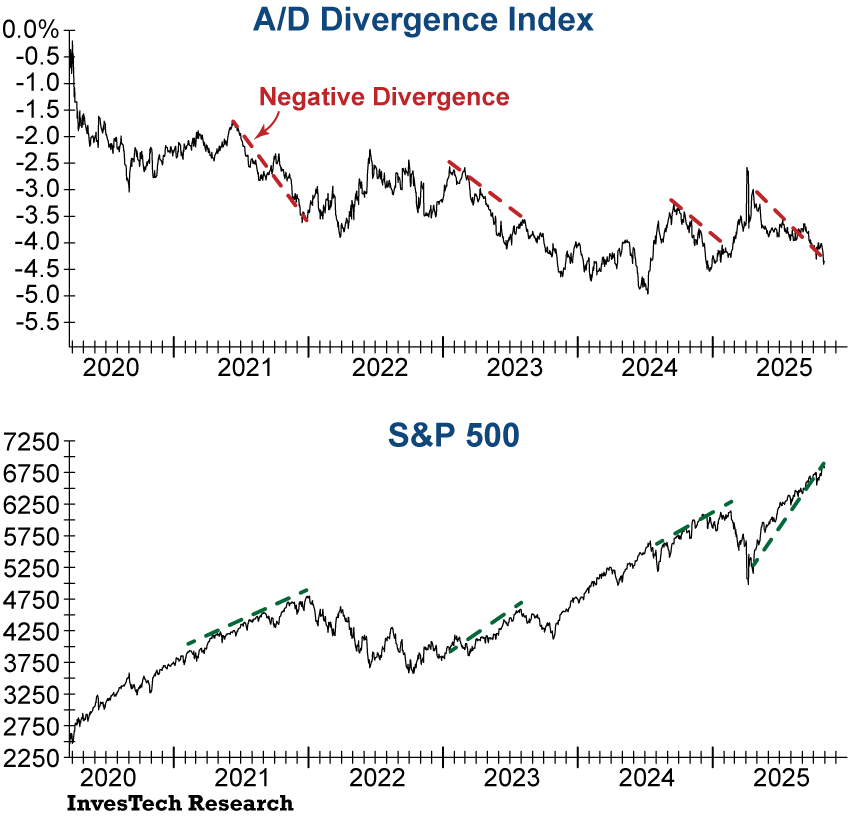
Currently, the A/D Divergence saw an acceleration in its decline, while the S&P 500 moved higher over the past 8 months. This is a key confirmation of the unique divergence in the Nasdaq – and a warning that the market is on unstable footing.
Today’s monetary outlook carries more risk than it may seem.
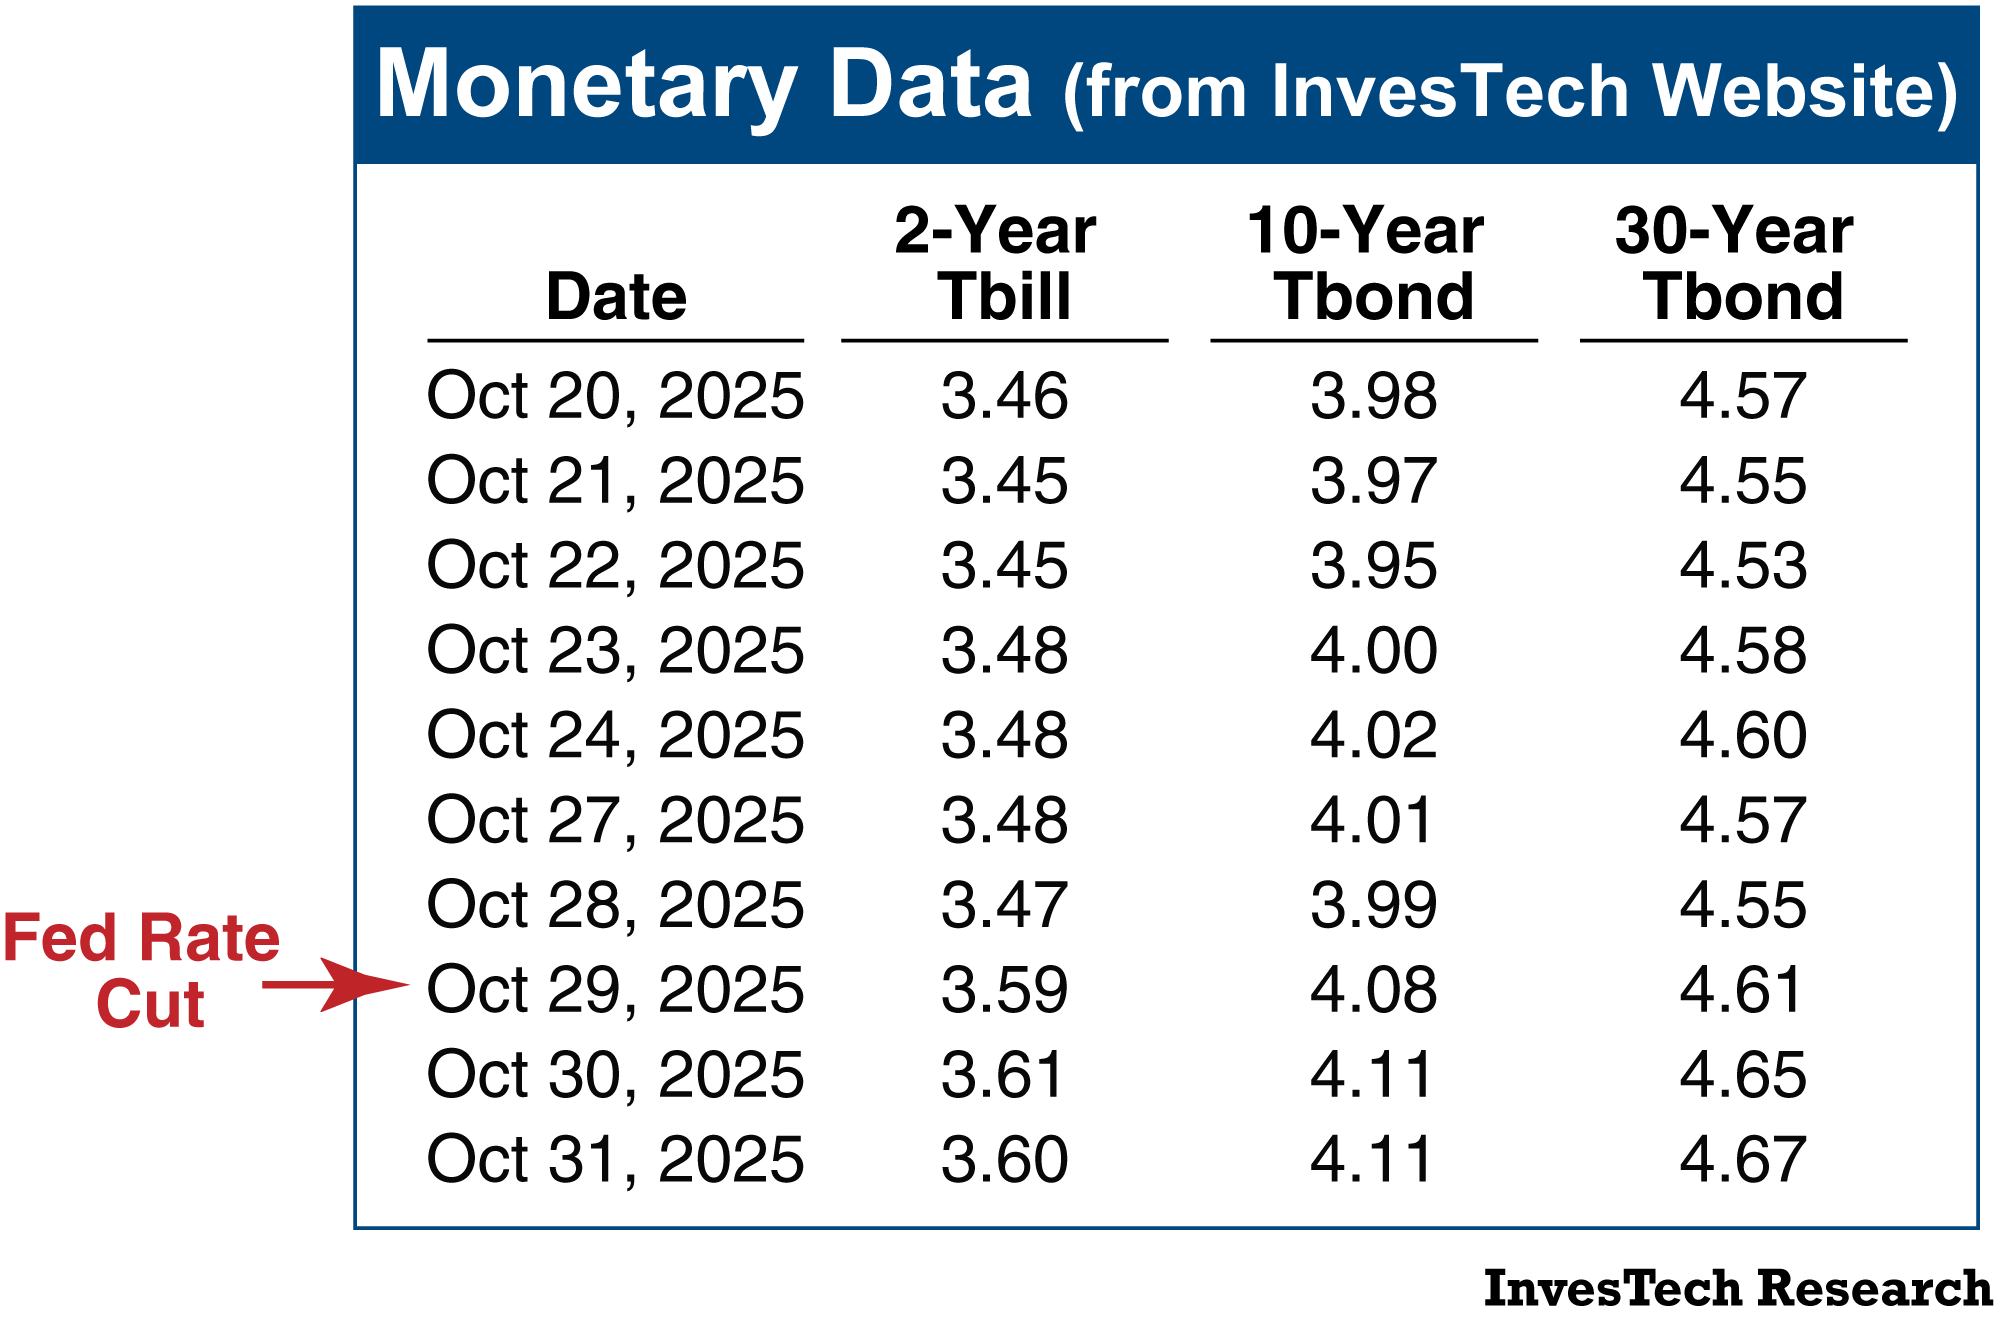
Last Wednesday the Fed lowered rates in what was perhaps the most widely anticipated rate cut in the past several years. However, monetary signals rang alarm bells when —at the same time— long-term rates moved upward. This confirms the market is not as confident in the Fed’s control of inflation as investors believe.
In fact, Fed Funds Futures show just a 65% probability of a rate cut in December, down significantly from the 94% probability just one week ago!
Fed governors are also concerned…
Friday October 31, 2025: 4 Fed officials strike hawkish tone on rate cuts, citing inflation concerns – YahooFinance
Ultimately, the widely anticipated “easy money” policy investors are betting on is not cast in stone.
Two other key InvesTech Indicators “bear” close watching.
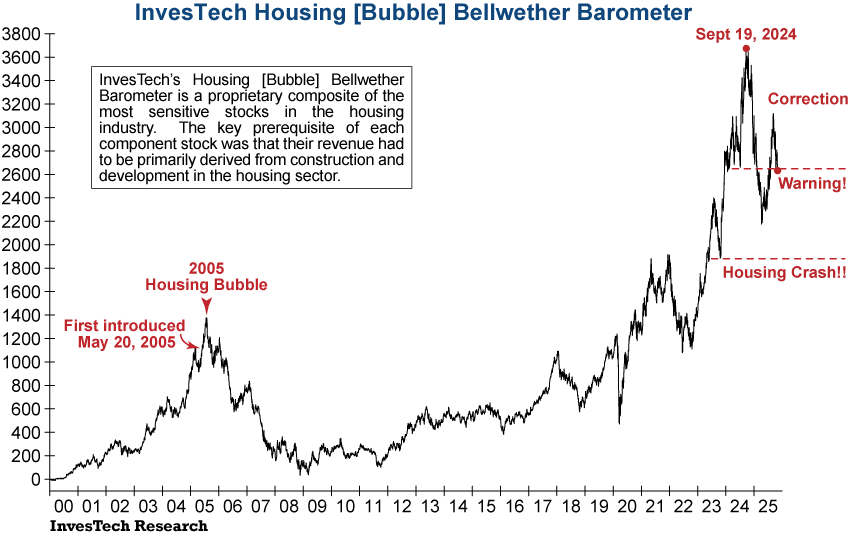
InvesTech’s Housing [Bubble] Bellwether Barometer broke through its warning level again today in a crucial development. Housing stocks had rallied in anticipation of rate cuts over the last few weeks but have since fallen back into the warning zone. As cracks in the foundation of the housing market continue to widen we will be keeping a close eye on this indicator which warned us of the peak in the Housing Bubble that preceded the Great Financial Crisis in 2007-2009.
The last —and perhaps most important— indicator to watch in the weeks immediately ahead will be our Negative Leadership Composite (NLC). Bearish Distribution emerged in our NLC late last year, accelerating downward and warning us of the near-20% market correction from February through April of this year.
Now we are watching InvesTech’s Negative Leadership Composite (NLC) for new confirmation that a market downturn is imminent. We are already seeing internal deterioration in the NLC on a daily basis, which could trigger bearish Distribution within the next several weeks.
In Summary…
Developing warning flags have been increasing even as market indexes eked out new highs, and these compounding critical warning flags signal that downside risk is rising. There has never been a more opportune time to bring your portfolio into alignment with our safety-first strategy and Model Fund Portfolio.
Also available to read in PDF format.