
Originally Published July 1998
Is Wall Street in a ‘New Paradigm Era’… or merely an ‘Old Bubble’ carried to New Extremes?
Santayana, an early 20th Century philosopher, once said, “Those who do not learn from the past, are doomed to repeat it.” And Sir Isaac Newton, who lost the equivalent of over $1,000,000 investing in the South Sea bubble of 1720, remarked, “I can measure the motions of bodies, but I cannot measure human folly.” However to this day, analysts cannot agree as to what constitutes a bubble… or how to recognize a bubble before the inevitable washout and aftermath.
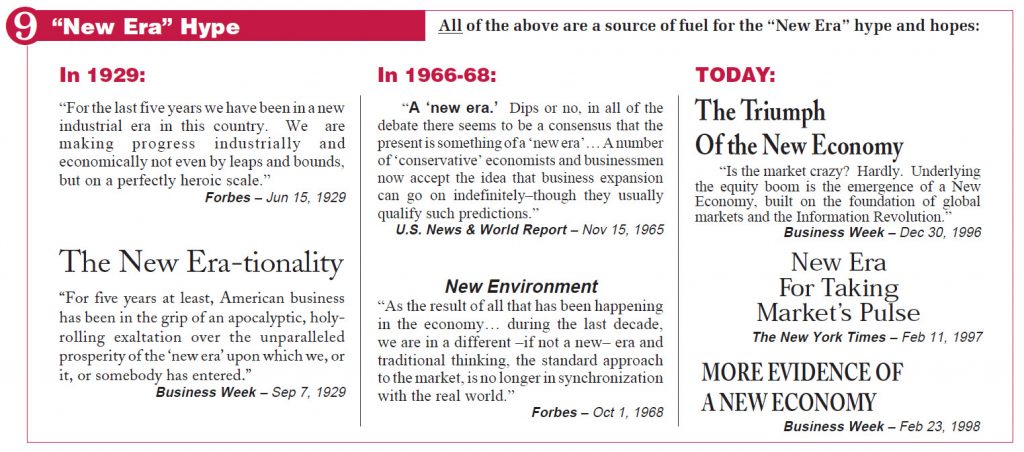
It is widely perceived that the U.S. economy and stock market have embarked on a “New Paradigm Era” in which old rules no longer apply and traditional barriers have been broken. Yet as Federal Reserve Chairman Alan Greenspan warned Congress on February 26th 1997, “Regrettably, history is strewn with visions of such ‘new eras’ that, in the end, have proven to be a mirage.” This is an insight into one such likely mirage…
What Constitutes A Bubble?
That the free enterprise economy is given to recurrent episodes of speculation will be agreed… This process, once it is recognized, is clearly evident, and especially so after the fact. So also, if more subjectively, are the basic attitudes of the participants. These take two forms. There are those who are persuaded that some new price-enhancing circumstance is in control, and they expect the market to stay up and go up, perhaps indefinitely… Then there are those, superficially more astute and generally fewer in number, who perceive or believe themselves to perceive the speculative mood of the moment. They are in to ride the upward wave; their particular genius, they are convinced, will allow them to get out before the speculation runs its course… For built into this situation is the eventual and inevitable fall. Built in also is the circumstance that it cannot come gently or gradually. When it comes it bears the grim face of disaster. That is because both of the groups of participants in the speculative situation are programmed for sudden efforts at escape. Something, it matters little –although it will always be debated– triggers the ultimate reversal.
A Short History of Financial Euphoria
John Kenneth Galbraith
Historically, bubbles have always been a part of the lessons of investing. There was the Japanese stock market and real estate bubble which popped in 1989. In domestic real estate, there was the not so “recession-proof” California, as well as the price deflation or washouts of condominiums in Hawaii… residences in the Northeast… commercial office space in the oil belt… and numerous other regions in the 1980’s. Many investors may also remember $850 gold… $50 silver… $37 oil… numismatics… baseball cards… and the list goes on.
In the stock market, bubbles are usually limited to individual sectors which ride high on excessively exuberant expectations – only to plunge back to earth later. Yet history has left several notable eras which were recognized as “bubbles” only in the eventual and inevitable devastation. Seasoned investors may remember the “Nifty Fifty” era… the “Go-Go Fund” era… or even the “Investment Trust” era of the 1920’s.
A Short History of Financial Euphoria
In essence, a bubble is created when objectivity, reasoning, and valuation give way to greed and the desire for profits. In “A Short History of Financial Euphoria,” author Galbraith describes the common seeds of past manias that inevitably give way to disastrous consequences:
- The basic premise that investing involves a trade-off between risk/reward is lost as investors are “captured by the wondrous satisfaction from accruing wealth. The very increase in values thus captures the thoughts and minds of those being rewarded.”
- The belief that “some new price-enhancing circumstance is in control” – that there is “something new in the world” that justifies a permanently higher level of valuation.
- The illusion that, except for temporary setbacks, “values are going up permanently and indefinitely.”
- The “condemnation at those who express doubt or dissent. … because of defective imagination or other mental inadequacy they are unable to grasp the new and rewarding circumstances.”
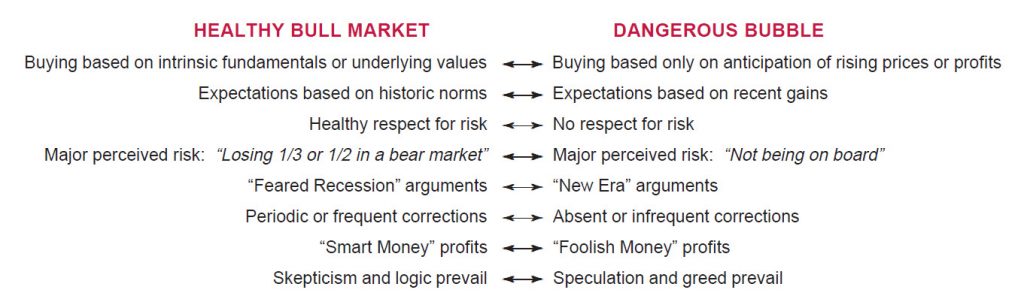
Healthy Bull Market to Dangerous Bubble
Yet only in the aftermath, is a “bubble” identified as a bubble. While in progress, it can only be recognized by its symptoms which are common with speculative eras of the past. At what point does a healthy bull market turn into a bubble ripe for the popping? Here are a few differences:
Time For A Reality Check…
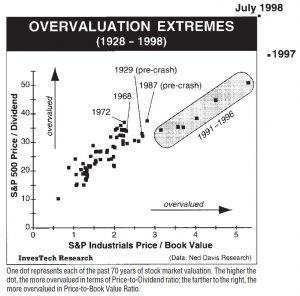
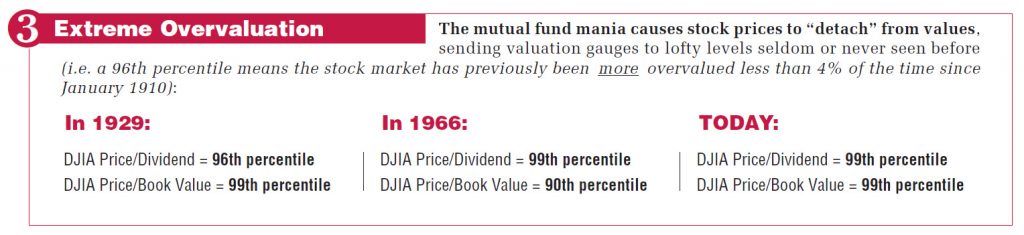
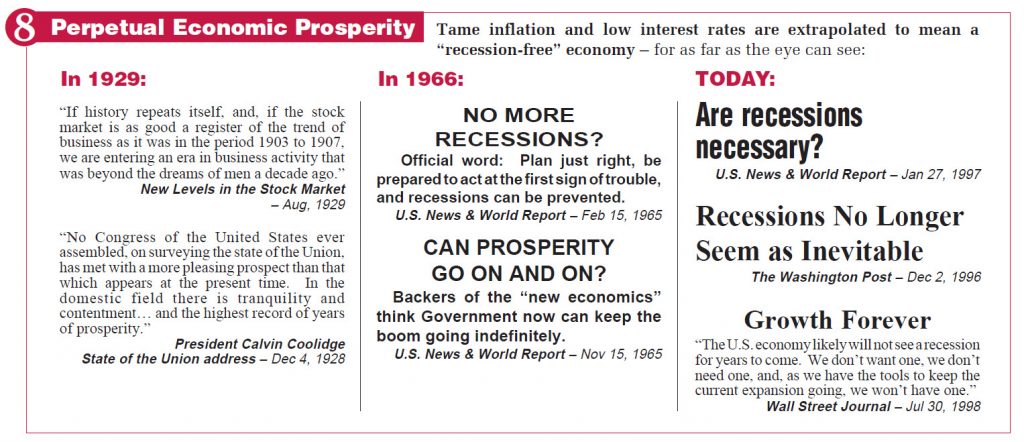
Wall Street consensus is that the U.S. has entered a “new era” of tame inflation, low interest rates, and rising productivity that will carry economic prosperity well into the new millennium. If so, say pundits, then today’s extreme valuation levels in the stock market are justified. Just how extreme is stock overvaluation? The figure at right shows the S&P 500 Price-to-Dividend Ratio on the vertical scale, and the S&P Industrials Price-to-Book Value Ratio on the horizontal scale. Simply, the higher on the chart, or the farther to the right a year appears, the more overvalued it is. Clearly, when compared to overvaluation at some of the most historic market tops such as 1929, 1968, 1972, and 1987… today (1998) is off-the-chart!
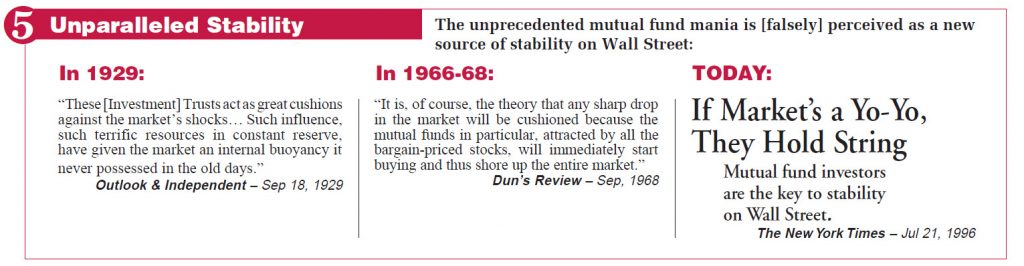
Consensus on Wall Street is also that today’s investor is smarter, better informed, more patient, and longer-term oriented than in the past. Consequently, it is believed that today’s mutual fund holder will never panic in a bear market. However, not all agree with this consensus:
Investors may overreact to a downturn, SEC warns
London Financial Times – Feb 26, 1997
Inexperienced investors who have known only the bull market of the last decade could react ‘precipitously’ to a downturn and ‘at great cost to themselves and our markets’, Mr. Arthur Levitt, chairman of the Securities and Exchange Commission
warned yesterday.
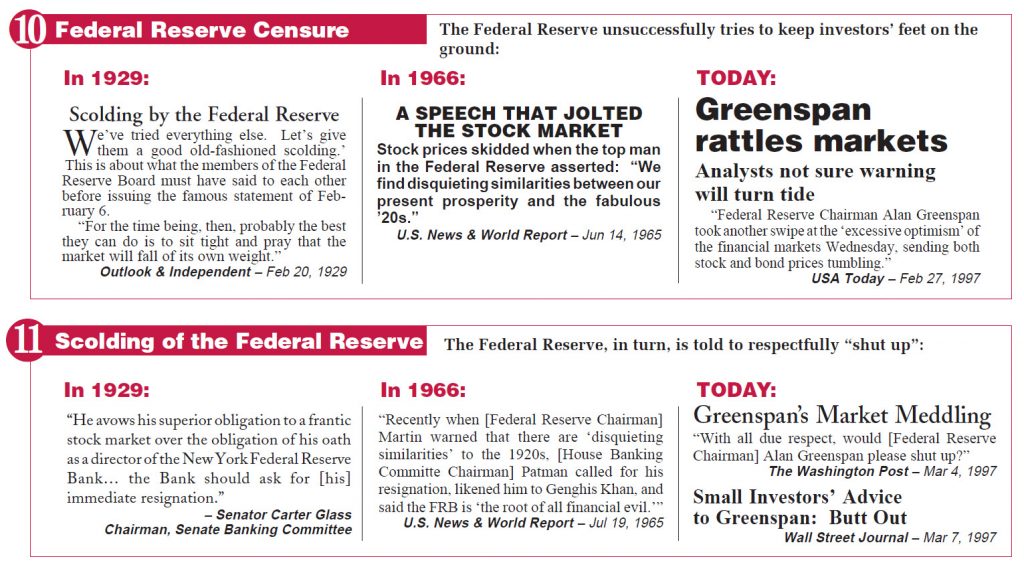
And Federal Reserve officials also appear nervous as evidenced by this Congressional Testimony in early 1997:
History demonstrates that participants in financial markets are susceptible to waves of optimism… Excessive optimism sows the seeds of its own reversal in the form of imbalances that tend to grow over time. When unwarranted expectations ultimately are not realized, the unwinding of these financial excesses can act to amplify a downturn
Federal Reserve Chairman Alan Greenspan
– Feb 26, 1997
Meanwhile, the cold fact remains that the assets in equity mutual funds now total $3,164 Billion, as compared to $226 Billion in October 1990 at the start of this bull market. Quite simply, 93% of the money in stock mutual funds has not experienced a bear market or even a -15% correction in blue chip averages!
Perhaps more ominously, an overwhelming majority of fund investors believe they never will experience such a decline. This late 1996 Lou Harris poll reveals that 85% expect the next 10 years to be as spectacular or better than the past decade. 78% are not expecting a mild bear market of -20%. And almost half think that minor -10% corrections are a thing of the past:
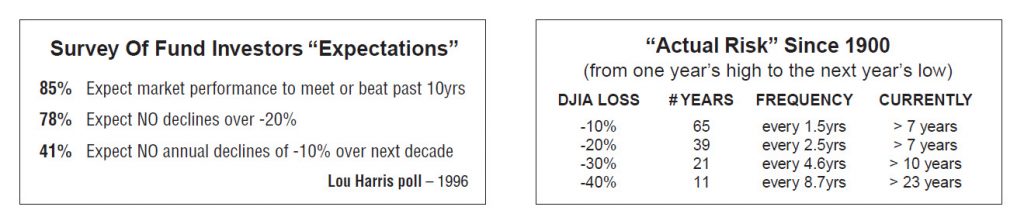
Just how far out of touch are these investor expectations with reality? Compare the “actual risk” for all the years of this century (above right). A -10% correction has occurred in 65 years, or once every 1.5yrs on average – yet 7 years have lapsed since the last. A -20% decline has triggered every 2.5yrs – again, over 7 years since the last. A -30% bear hits every 4.6yrs – last seen during the ’87 Crash. And a major bear, with -40% losses, strikes about every 8.7yrs… last felt by investors 23 years ago!
Is it a contest to see who can forecast the highest level for the stock market? No… more likely it’s just a not-so-mild case of “irrational exuberance” feared by the Federal Reserve.
Reality Check: Bull or Bubble?
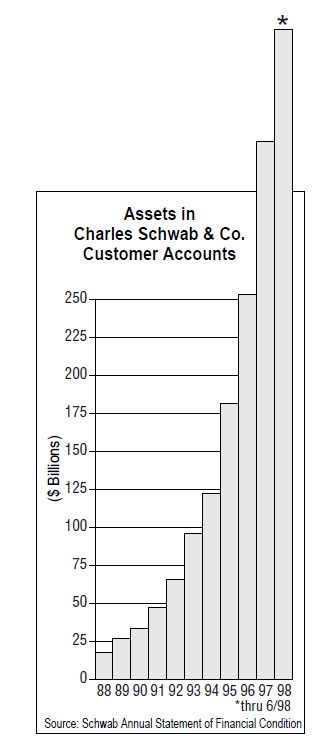
Public investment funds placed with the nation’s largest discount brokerage firm have risen over 19-fold in less than a decade.
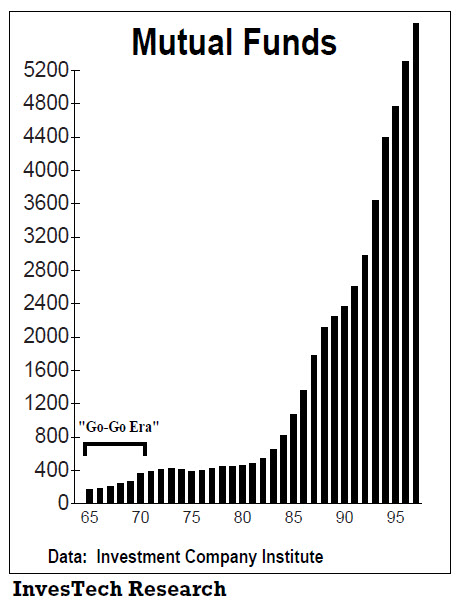
Reality Check: Bull or Bubble?
Since 1981, the number of mutual funds have multiplied at a rate far above any historical experience… far above the “Go-Go Fund” era of the 1960’s… and far above the “Investment Trust” era of the 1920’s.
Reality Check: Bull or Bubble?
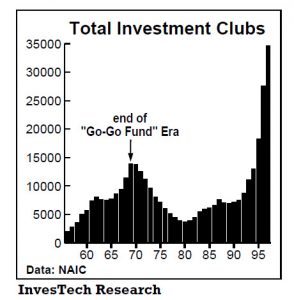
The number of investment clubs has increased over 5-fold in the current bull market. Today, more than 1 in 3 adults own mutual funds – a 66% increase in four years. That easily surpasses the “Go-Go Fund” era in which 1 in 4 adults owned stocks when the washout began in 1969.
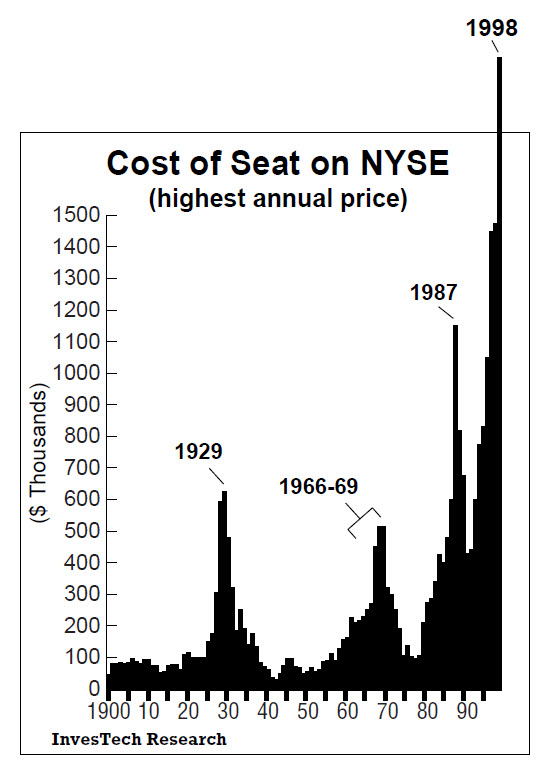
Reality Check: Bull or Bubble?
Market historians note that stock market bubbles have been accompanied by a “bubble” in the price of a seat on the New York Stock Exchange. In March 1998, a seat sold for a cool $2.0 million – far above the peak prior to the 1987 Crash. Also note the 1929 and 1966-69 peaks… which will become relevant in the next section of this report.
Reality Check: Bull or Bubble?
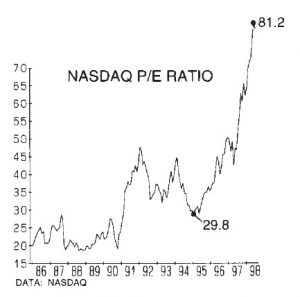
Safety in diversification? Certainly not in small-caps. The cumulative P/E ratio of all domestic NASDAQ stocks has been hitting unprecedented, frothy levels. It would require a decline of over -75% to take the NASDAQ P/E ratio back to where it started this bull market in October 1990.
Reality Check: Bull or Bubble?
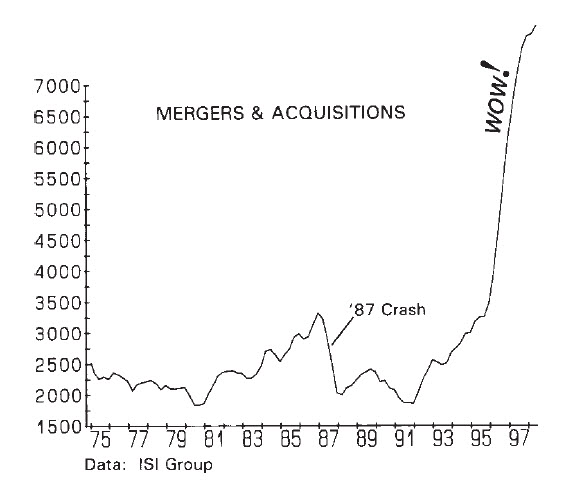
Mergers and acquisitions? Since 1996, there’s been no “deal” too big, too expensive, or too leveraged for Wall Street to piece together.
Reality Check: Bull or Bubble?
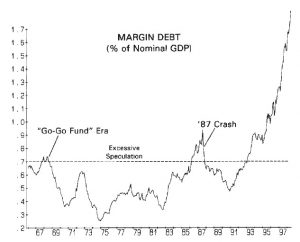
Margin debt (money borrowed to purchase stocks) has soared to record levels – even relative to the size of the economy. Note how far it is above the dangerous peaks in 1987, 1972, and 1968… just prior to the three biggest bear markets of the past half century. And of course, this doesn’t include the second mortgages, refinancings, or record credit card debt that has been used to divert funds into the stock market.
Reality Check: Bull or Bubble?
The Inevitable Questions:
- What has driven stocks to such overvalued extremes?
- Why do the SEC and our Federal Reserve seem so worried?
- Why are investor expectations so out-of-touch with reality?
- What has created so many symptoms of a dangerous “bubble”?
TODAY: The Not So “New Paradigm Bubble”
Many reasons, excuses, and theories have been postulated for Wall Street’s exuberance today. They range from advances in technology, to increases in productivity, to changing demographics (aging baby-boomers). Yet these all miss the mark in explaining how Wall Street arrived at DJIA 9000 from DJIA 800 in 1982. In 1981 when President Reagan took office, interest rates were above 13%, gold had recently hit $850/oz, the DJIA was at the same level as in 1966, and real estate was considered by all to be the safest, best long-term investment. What happened? What changed public opinion so dramatically?
The answer is “disinflation”. As inflation receded over the past 16 years, so did the fear or expectations of inflation. Gold lost its luster. Real estate washouts in the oil belt, California, and the Northeast removed its “safe haven” perception. And as interest rates slipped year after year, thrifty CD and money market fund savers were pushed to seek other alternatives… the stock market. A “Disinflation Era” is not new… and neither is the dangerous bubble which it can create. Let’s examine historical precedent:
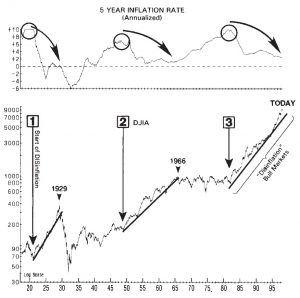
THE INVESTMENT TRUST ’20s
Start: August 1921 – as the high inflation of World War I receded.
Stocks: DJIA up 6-fold in 8 years.
THE GO-GO FUND ’60s
Start: June 1949 – as the high inflation of World War II (and the Korean War) receded.
Stocks: DJIA up 6-fold in 17 years (with subsequent tops in 1968 and 1973).
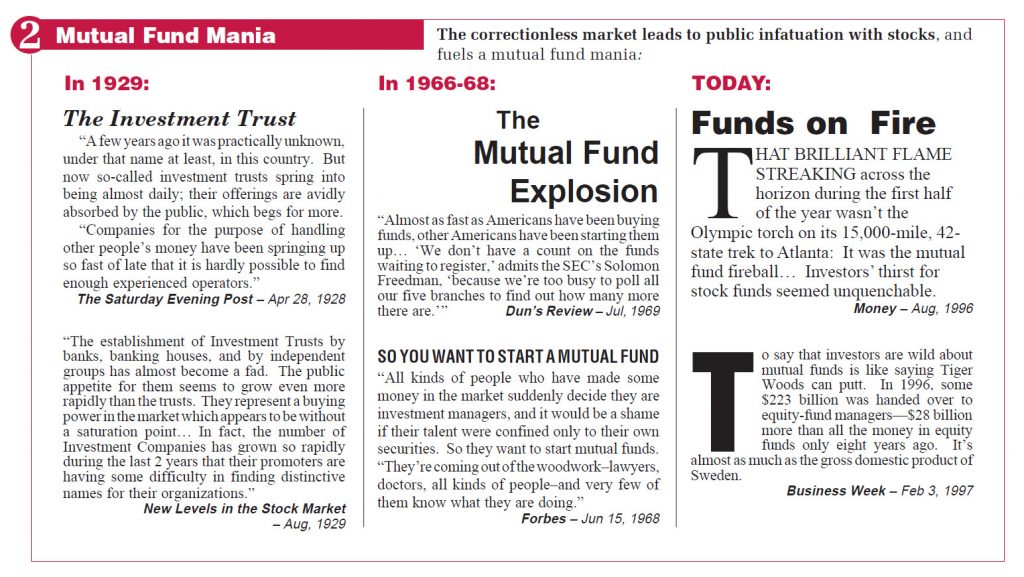
THE MUTUAL FUND MANIA ’90s
Start: August 1982 – as the high inflation of the Vietnam War and the 1970s receded.
Stocks: DJIA up 11-fold in 16 years.
Here are the ominous parallels and sequence of events in these “Disinflation Eras”:
What the Future Holds…
A stock market bubble can be prevented, but it can’t be corrected…
Painful recessions and periodic bear markets can usually prevent the valuation extremes and sentiment excesses that create a dangerous bubble. Yet tragically, this simple, historic fact must be relearned every time. For example, after the Japanese stock market and real estate collapse, the former head of the Bank of Japan lamented:
Looking back, we now feel that we should have applied the brakes on the excessive boom much earlier… However, back in those days, as [consumer] prices were not rising, it was difficult to obtain people’s understanding for a policy aimed at achieving sustainable economic growth by monetary tightening.
Yasushi Mieno, Former Governor, Bank of Japan
The historical truth that bubbles can be prevented but not corrected even appears obvious to those involved in creating the current bubble, as evidenced by this 1996 quote from the former Federal Reserve Vice-Chairman:
It’s very hard to surgically prick a balloon. You may let out a lot more air than you bargained for.
Alan Blinder, Former Vice Chairman, Federal Reserve
And in an article from 30 years ago, the current Federal Reserve Chairman wrote this critique of the 1929 Crash:
The excess credit which the Fed pumped into the economy spilled over into the stock market – triggering a fantastic speculative boom. Belatedly, Federal Reserve officials attempted to sop up the excess reserves and finally succeeded in braking the boom. But it was too late: by 1929 the speculative imbalances had become so overwhelming that the attempt precipitated a sharp retrenching and a consequent demoralizing of business confidence.
Alan Greenspan, “Gold and Economic Freedom”, 1966
Yet the mere presence of a bubble, even with all the overvaluation and extremes, rarely pops itself. It may continue to inflate, transparent to those inside the bubble, until some external event causes the initial pinhole. As John Galbraith noted about past bubbles, “Something, it matters little –although it will always be debated– triggers the ultimate reversal.”
From whence could the pin or trigger come?…
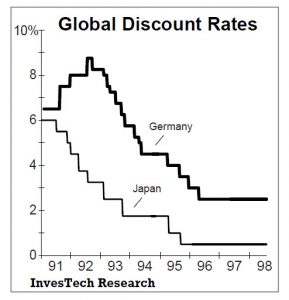
Global economic and financial turmoil offer a number of potential sources. Recessions in Germany and Japan have driven interest rates down to 1/3 of levels in 1991-92 (or 1/12 in the case of Japan). However, the frenzied effort to jumpstart foreign economies has instead pushed excess liquidity into the U.S. financial markets.
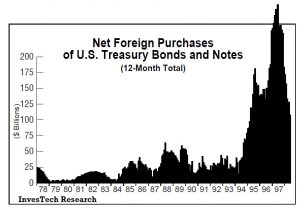
As a result, purchasing of U.S. Treasuries by foreign investors and central banks has soared to unprecedented levels. The short-term benefits have funded our trade deficit, supported the Dollar, and sloshed liquidity into Wall Street. The obvious danger is what might happen now that this trend shows signs of reversing.
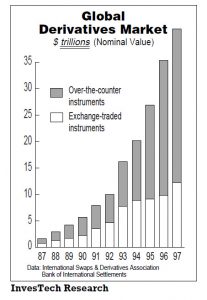
Another potential trigger resides in the global derivatives market. It’s assumed by today’s young gun-slinging money managers that such leveraged derivatives are as liquid as cash – even in a falling market or financial crisis. However, note that the face value of these global derivatives now totals over $41 trillion… 6 times larger than in the last U.S. recession… and 17 times larger than when liquidity disappeared during the 1987 Crash. That $41 trillion has never experienced a true global recession or liquidity crisis. What happens if speculators all want out at the same time?
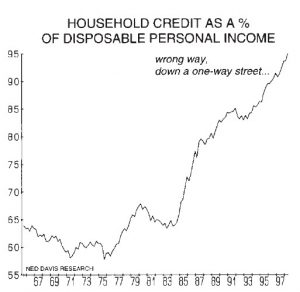
Liquidity could also prove a problem for today’s consumers. Household debt (even as a percentage of income) continues to rise to record levels. Personal bankruptcies are also at record levels – even in this 8th year of economic expansion. With consumer spending accounting for 2/3’s of GDP growth, how long can households keep heading the wrong way down a oneway street?
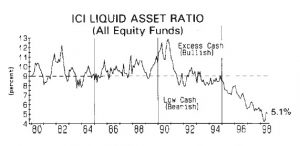
If illiquidity is the trigger, mutual funds are sitting on the target. Cash reserves, tracked by ICI, have been reduced to the lowest levels of this 16-year disinflation bull. Meanwhile, nervous fund families, including Fidelity and Vanguard, have requested permission from the SEC to borrow from money market funds to meet redemptions if necessary. Some are even “investing” cash reserves in stock index futures. Is it confidence, ignorance, or recklessness that leads mutual funds down the same path as in the Go-Go Fund 1960’s, or as the Investment Trusts of the late 1920’s?
Threat of a Crash…
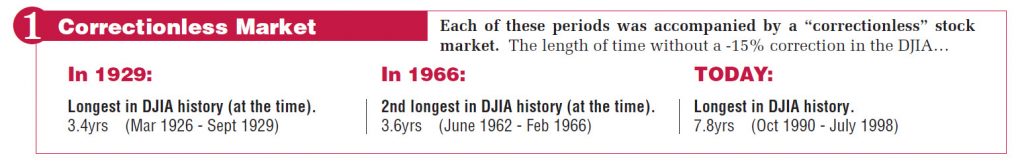
- This 7.8 years without a -15% correction in the DJIA is virtually double the previous record. Among the 5 longest such periods… are the 1929 Crash and 1987 Crash. Coincidence?
- This 16th year without the DJIA dropping under the previous year’s low is double the previous record of 8 years… which ended in the 1929 Crash. Coincidence?
- Intraday volatility (daily high-to-low) is averaging over 2% (~180 DJIA points) for 1997-98. Among the 3 previous records… again, 1929 and 1987. Coincidence?
Historical precedent paints a foreboding picture. A “crash” is always a possibility in a correctionless, overvalued stock market. And none have been as correctionless or as overvalued as this one. Wall Street confidence relies heavily on the Federal Reserve and its ability to control or halt a meltdown scenario. Media has publicized the “un”official Plunge Protection Team, comprised of the Federal Reserve, Treasury, SEC, and CFTC – all of whom are “thinking carefully about how they would respond to the unthinkable” on Wall Street. Only time will tell if such confidence is misplaced…
Plunge Protection Team
The Washington Post
White House Group Shapes Plans to Ensure
Any Market Free Fall Is Contained
Weighing the Dangers…
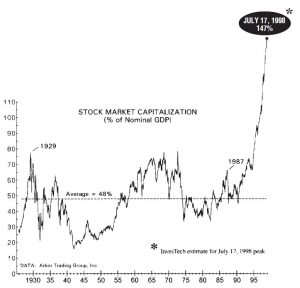
Today’s parallels with history, and repeated warnings from the SEC and the Federal Reserve carry ominous overtones. A correctionless bull market, record overvaluation, plus public exuberance all add up to unprecedented risk – for the stock market, as well as the U.S. economy. By July 1998, stock market capitalization (in relation to GDP) has reached over twice the peak before the last recession or prior to the 1987 stock market crash. Simply stated, even a mild bear market of -25% from today’s lofty levels, would wipe out $2.8 trillion – with more economic impact than any bear market of the past 60 years!
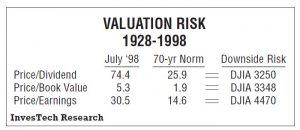
To Alan Greenspan, who wrote so astutely of the lessons of 1929, the threat must weigh heavily. The anecdotal evidence is overwhelming that Wall Street is in some type of bubble – a mania where valuations and expectations have disconnected from reality. If that is indeed the case, then what lies ahead is inevitable. And the downside risk is grossly underestimated by today’s investor. With valuations based on the broad S&P 500 Index (but downside risk expressed in more familiar DJIA point terms), the table below shows how far today’s stock market could tumble before hitting 70-year average valuations. NOTE: This is only to average valuation levels since 1928, not the extreme lows that are typical in most bear markets!
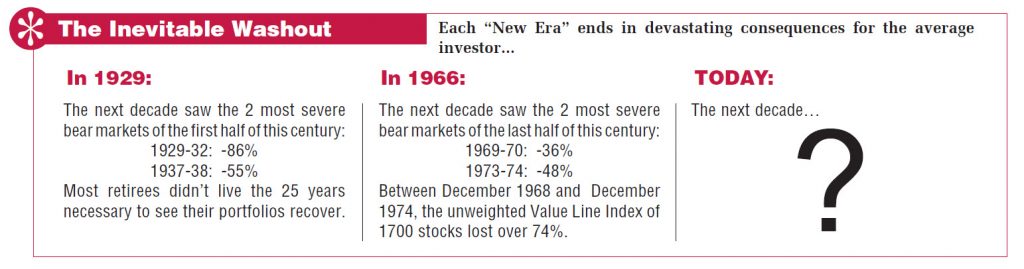
In one sense, it doesn’t matter whether today’s bubble unwinds in a deflationary crisis as in 1929, or in a series of protracted bear markets as in the late 60’s. The consequences for the average investor were the same. Those who blindly followed a buy-&-hold strategy were devastated, both financially and psychologically. Meanwhile, those investors who recognized the dangers and took evasive action weathered the fallout – or even profited handsomely in the years that followed.
It also matters little, if it is a bubble, what circumstance or event is blamed for “pricking” the overinflated balloon. Inevitably, the fact remains that much of the fault must lie with Wall Street itself. If not for the sirens and aggressive marketing in an overextended, overheated, overvalued bull market, then the excesses and speculation couldn’t reach such extremes.
The purpose of this special report is not to frighten or build the case for a crash. Our sole objective is to educate. It is a dangerous, perhaps even financially fatal assumption to think the next 5 years will be a repeat of the recent past. But historical precedent cannot be ignored. The 1980’s and 90’s are not the first era where investors have been pushed away from inflation hedges, real estate, bonds, and cash. And, as revealed inside, it would not be the first such bubble created by these disinflation forces.
Only time, and 20/20 hindsight, will reveal if today’s “new era” is a mirage – merely an old era carried to new levels of excess. Unfortunately, the symptoms are present and warning flags are flying high. Yet even if Wall Street is in a bubble destined to deflate, one must also remember that the devastation which followed the late 20’s and late 60’s created tremendous profit opportunities for those astute investors who understood and perceived what was happening. The historical perspective and evidence presented in this report serve as a vital step in that direction.
InvesTech Special Report published July 1998
This report is also available to read in PDF format.