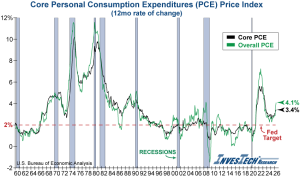
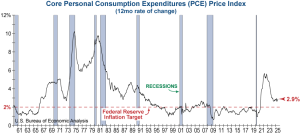
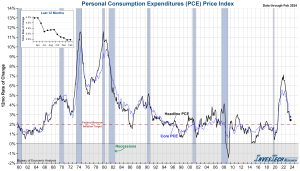
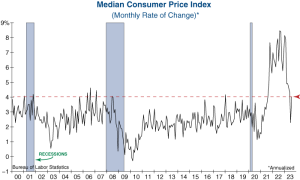
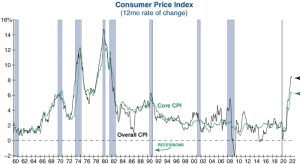
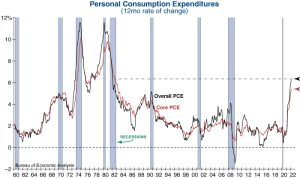
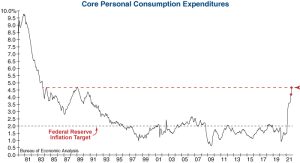
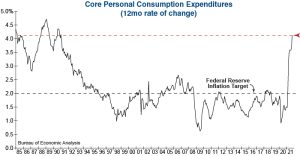
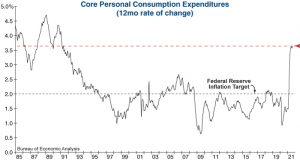
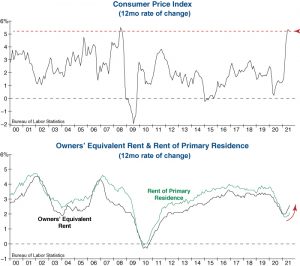
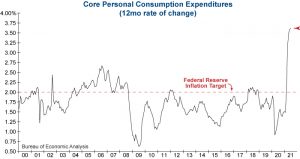
The Personal Consumption Expenditures (PCE) Price Index showed quickly rising prices as it increased from 3.8% to a 4.1% annual rate - the highest in 3 years.
Read MoreMarket Insights
Keep up with InvesTech’s review of economic news and data releases and how these may affect your investing. Visit regularly to read new Market Insights posted below.
To see when upcoming releases are scheduled, select the following Economic Calendar. Release dates represent when data is available from their respective sources. Check back here for the latest updates!
Follow us on social media to see when new insights are published!
Follow us on Social Media:
If you’re a subscriber: Sign up for emails when new Market Insights are available in your My Account area.
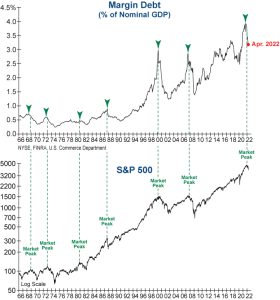
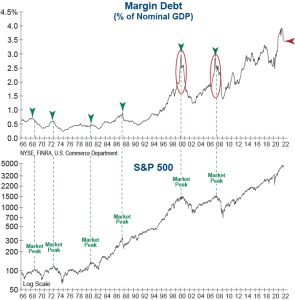
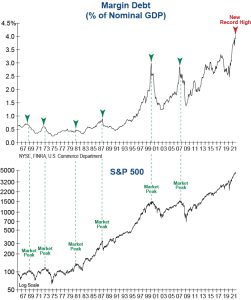
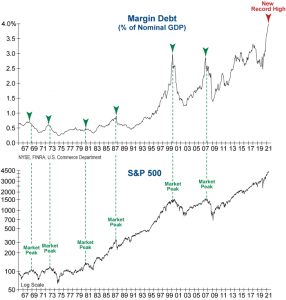
Margin Debt Reaches New Extremes
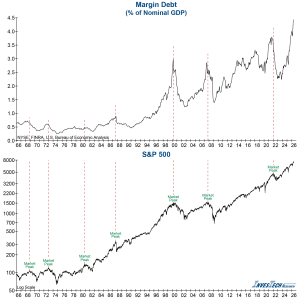
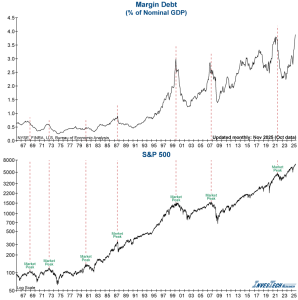
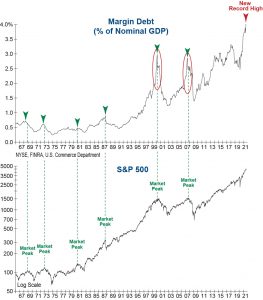
Margin Debt as a percentage of nominal GDP shot up 9% in May, reaching a new all-time high.
Read MoreHousing Starts Plunge to 6 Year Low
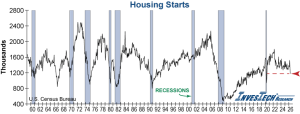
Housing Starts fell -15.4% in the latest reading following an -8.5% decline in April.
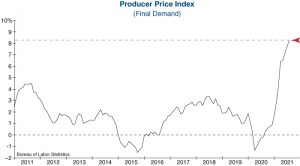
Read MoreHot PPI Warns Prices Could Have Further to Climb
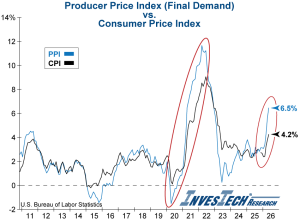
The Producer Price Index (PPI) for final demand shot up in May to 6.5% year-over-year.
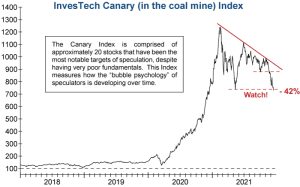
Read MoreThe Speculative Frenzy Could Be Hitting a Wall
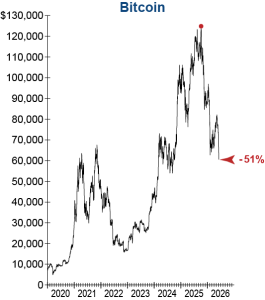
While we are far from cryptocurrency enthusiasts, we monitor Bitcoin because it can serve as a measure of investors’ risk appetite.
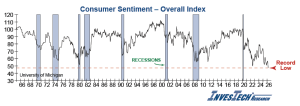
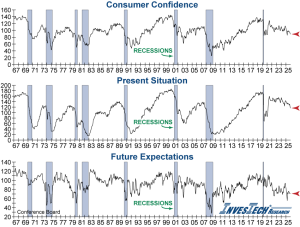
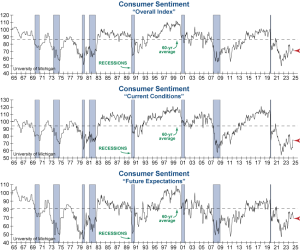
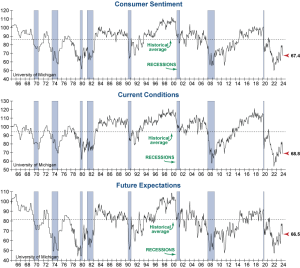
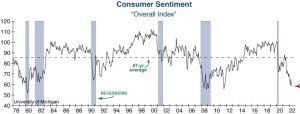
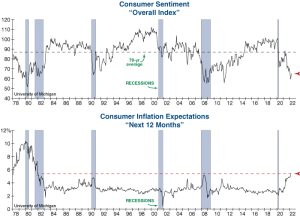
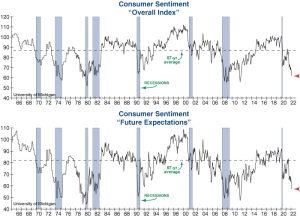
Read MoreConsumer Sentiment Tumbles to Record Lows Across the Board
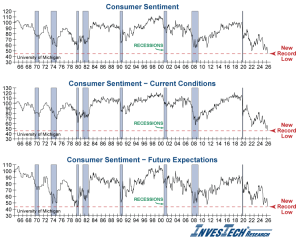
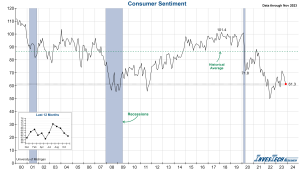
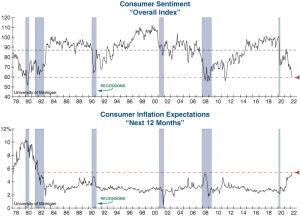
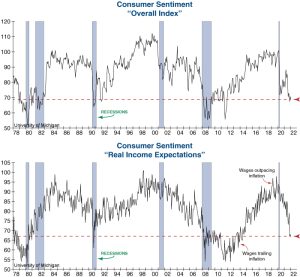
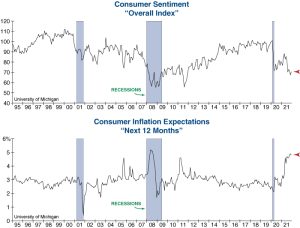
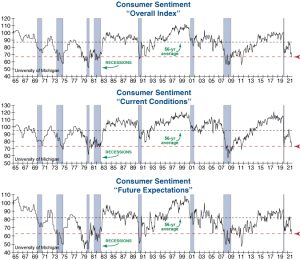
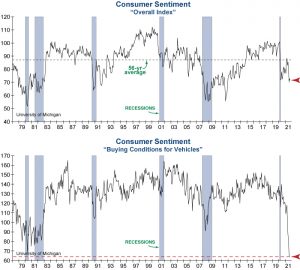
Consumer Sentiment plummeted to a new all-time low of 44.8 in its final reading for May as both the Current Conditions and Future Expectations subindexes collapsed.
Read MoreA New Warning Flag Reemerges
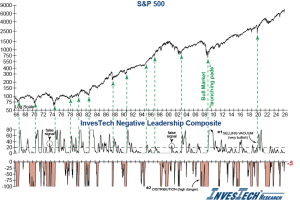
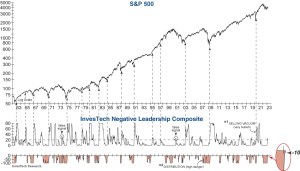
Bearish Distribution in InvesTech’s time-tested indicator, the Negative Leadership Composite (NLC), has reemerged in a sign that there could be more trouble ahead.
Read MorePPI – Another Hot Read on Inflation
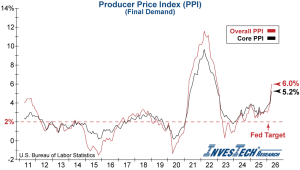
The Producer Price Index (PPI) for final demand shot up in April from a 4.3% year-over-year rate in March to 6%...
Read MorePCE Shows Reheating Inflation
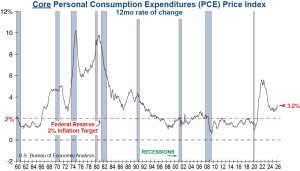
The Personal Consumption Expenditures (PCE) Price Index release today confirmed inflation is rearing its ugly head again.
Read MoreConsumer Sentiment Plunges to All-Time Low
Consumer Sentiment from the University of Michigan plummeted to a record low in its April release.
Read MorePrice Pressures Intensify
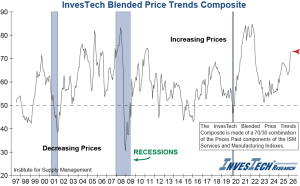
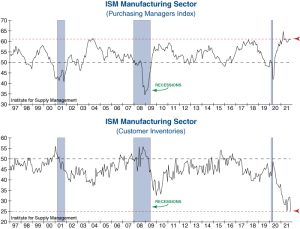
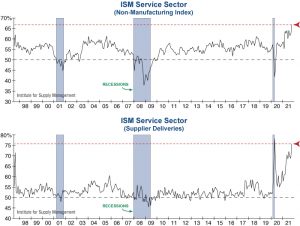
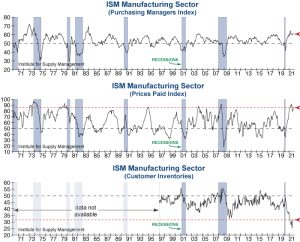
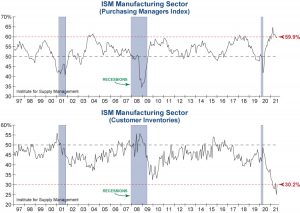
The latest Institute for Supply Management (ISM) reports showed both manufacturing and services remaining in expansion territory. However, the reports also revealed...
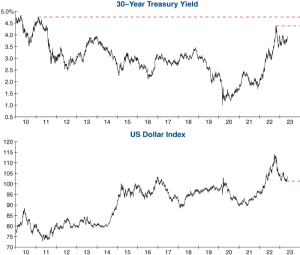
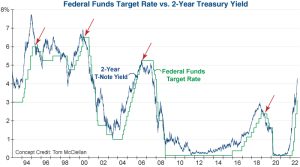
Read MoreBond Vigilantes – Tightening in spite of the Fed!
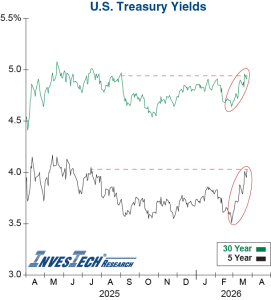
Bond Vigilantes are back, and they are tightening in place of the Fed like they did in the early 1980s.
Read MoreHot Margin Money on the Verge of Red-Hot Warning?
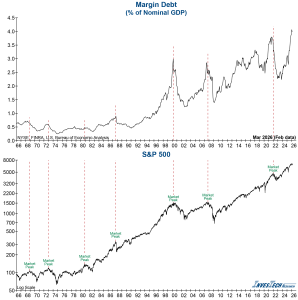
Margin Debt as a percentage of nominal GDP recently hit an all-time record high – far exceeding the peaks prior to the 2000 Tech Bubble Washout and the 2007-09 Great Financial Crisis.
Read MoreKey Lessons From Past Military Conflicts…
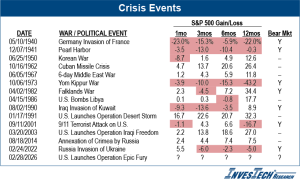
The escalation of the war in the Middle East is dominating the news, and investors are increasingly worried about the impact of this conflict on the stock market.
Read MoreISMs Show Economic Strength… Or Is It Just a Mirage?
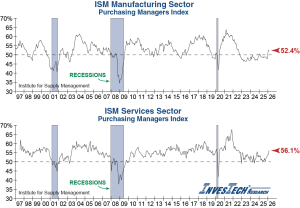
Earlier this week both the Institute for Supply Management (ISM) Manufacturing Purchasing Managers’ Index (PMI) and ISM Service PMI came in stronger than expected. However, tariff uncertainty and geopolitical instability could continue to make these key reports volatile.
Read MoreLeading Indicators Point Toward Further Slowdown in Housing
This week has been filled with disappointing economic releases regarding the state of the housing market.
Read MoreAnother Warning Shot Across the Housing Market Bow
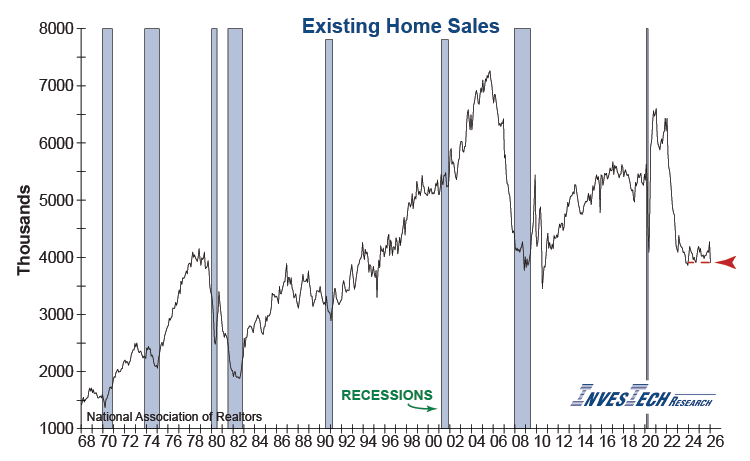
Existing Home Sales plummeted -8.4% in January, falling to the lowest level in over a year.
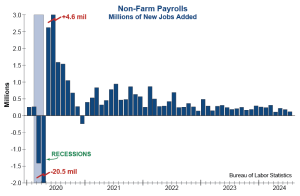
Read MoreWill the Real Jobs Data Please Stand Up?
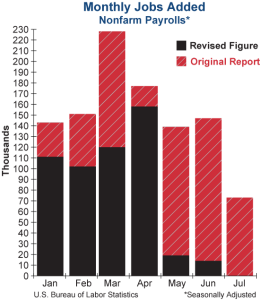
The latest Jobs Report appeared rosy on the surface, but revisions painted a far more concerning picture of a weak labor market.
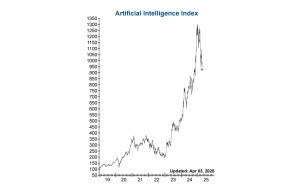
Read MoreIs the Floor Falling Out from Under AI?

Technical alarm bells are ringing as InvesTech’s Artificial Intelligence (AI) Index tumbled on souring investor sentiment, falling more than -13% in less than two weeks.
Read MoreUS Services and Manufacturing Sectors – Positive, but…
Both the Institute for Supply Management (ISM) Manufacturing and Services Reports were released this week showing positive developments. However, trouble lurked beneath the surface…
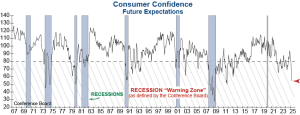
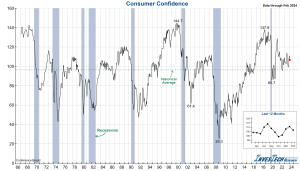
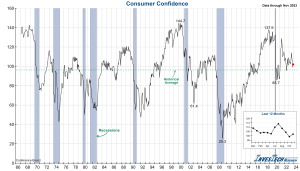
Read MoreConsumer Confidence Tumbles
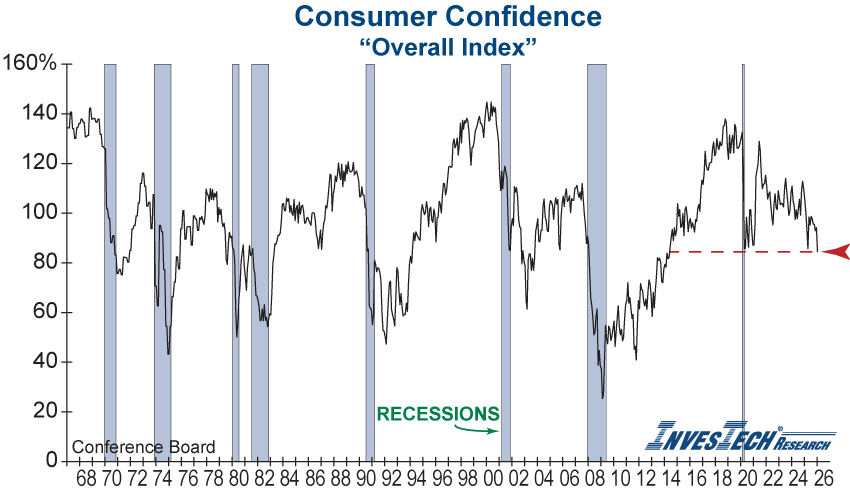
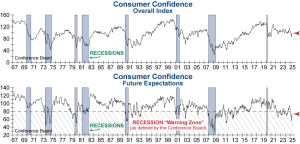
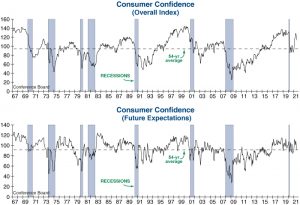
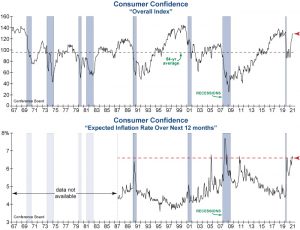
Today’s Consumer Confidence report showed that consumers are off to a grim start in 2026 as the Overall Index plummeted to its lowest level in 12 years!
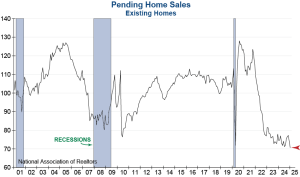
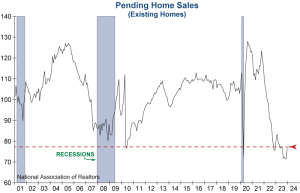
Read MorePending Home Sales Plummet Unexpectedly
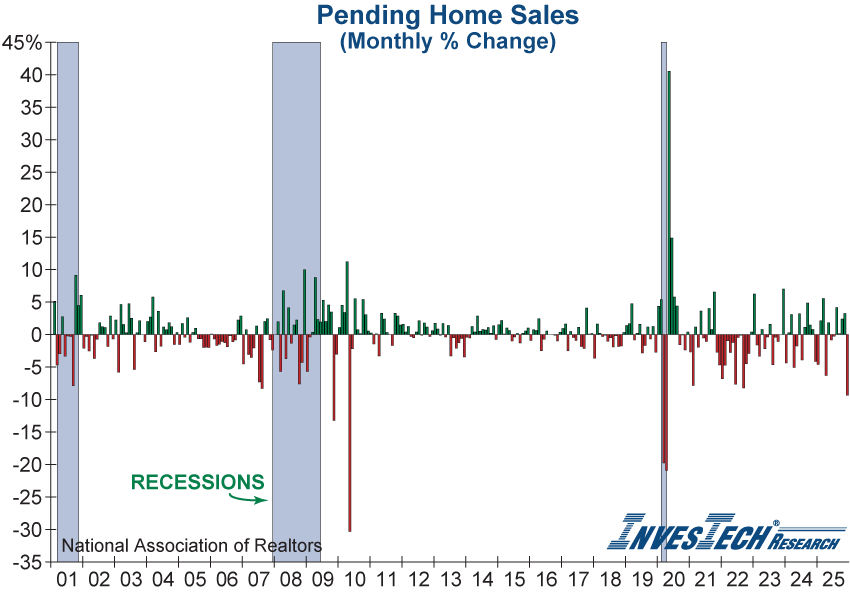
Pending Home Sales tumbled in the latest release, falling to the lowest level in 5 months.
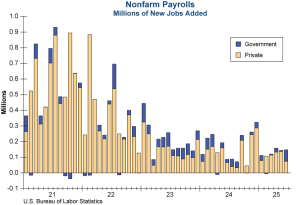
Read MoreFinal Jobs Report of 2025 Confirms Cooling Labor Market
The lastest jobs report showed stalling growth and contained some concerning warnings for the path ahead.
Read MoreConsumers End the Year in a Slump
The latest release of Consumer Confidence sent an ominous message for the U.S. economy as consumer attitudes crumbled.
Read MoreWas Today’s Jobs Report a Fluke?
Underlying data shows the employment picture may be even more ominous than the unemployment rate depicts, but is the report distorted by the recent government shutdown?
Read MoreTwo Things to Know Heading into The Fed Decision
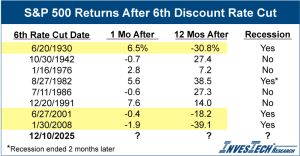
Heading into the Fed Rate Decision today, markets are pricing in a 90% probability of a rate cut. Here's what that could mean for the stock market and economy.
Read MoreCritical Indicator Confirms Bear Market Warnings
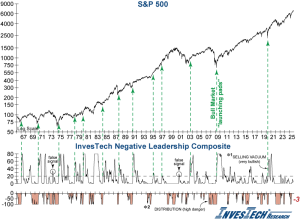
InvesTech’s Negative Leadership Composite has just joined the ranks of other major indicators warning of danger ahead.
Read MoreLeverage Hits New Highs – Don’t Look Down
Margin debt, which represents the amount of money borrowed by investors to buy stocks on margin, jumped +5% in its latest release warning of extreme downside risk.
Read MoreUS Consumer Sentiment Barometer Hits an All-Time Low!
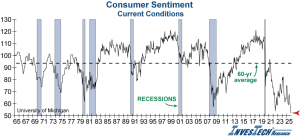
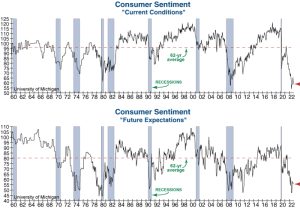
Consumer Sentiment from the University of Michigan rang another warning bell for the U.S. economy this morning as the Current Conditions Index fell from 58.6 to 52.3 in November – its lowest level on record.
Read MoreSpecial Report: Compounding Critical Warning Flags
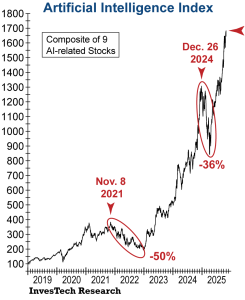
In recent weeks, as our speculative InvesTech AI Index soared to new highs, the market has sent a concerning message along a number of important technical and monetary fronts.
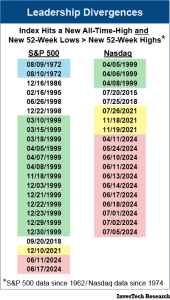
Read MoreGet the Market a Mint because it has BAD BREADTH
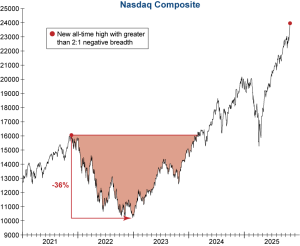
While the Nasdaq Index inched to a new high yesterday, a unique negative divergence occurred for only the 2nd time in 54 years!
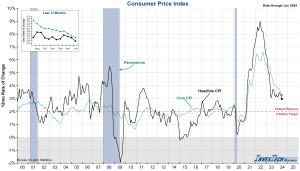
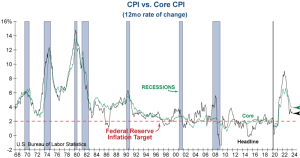
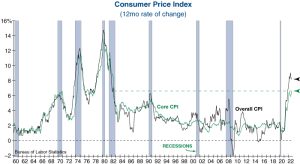
Read MoreCPI Clears the Way for Fed Rate Cut
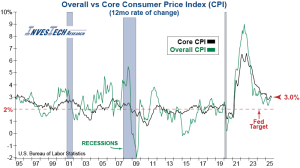
CPI Clears way for Fed Rate Cut, but is a long, bumpy ride ahead?
Read MoreGold Blasts Through $4000 and Sets a New Record
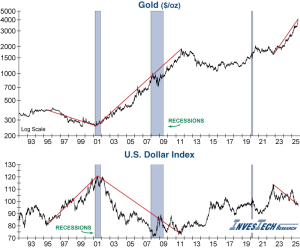
Gold rocketed up through $4000 dollars an ounce today, securing a record high price.
Read MoreGovernment Shutdowns – Market Impact

The U.S. Government entered a shutdown earlier this week, raising questions on what this means for the market and the U.S. economy.
Read MoreConsumers Send an Ominous Message
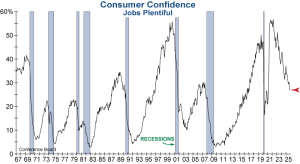
The Consumer Confidence Report for September revealed concerning weakness in the U.S. economy.
Read MoreBuilding Permits Raise a Red Hot Warning Flag!
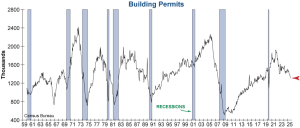
A newly released leading economic indicator developed by Moody’s Analytics identified Building Permits as “the most critical economic variable for predicting recessions” and here is the vital message today…
Read MoreSpeculative Frenzy Reaches New Heights
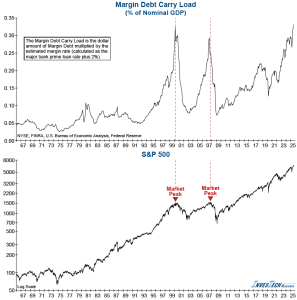
Updated October 24, 2025: In the September release, margin debt increased by nearly $40 billion, pushing the Margin Debt Carry Load to the highest level on record and ringing alarm bells for the level of risk in the market.
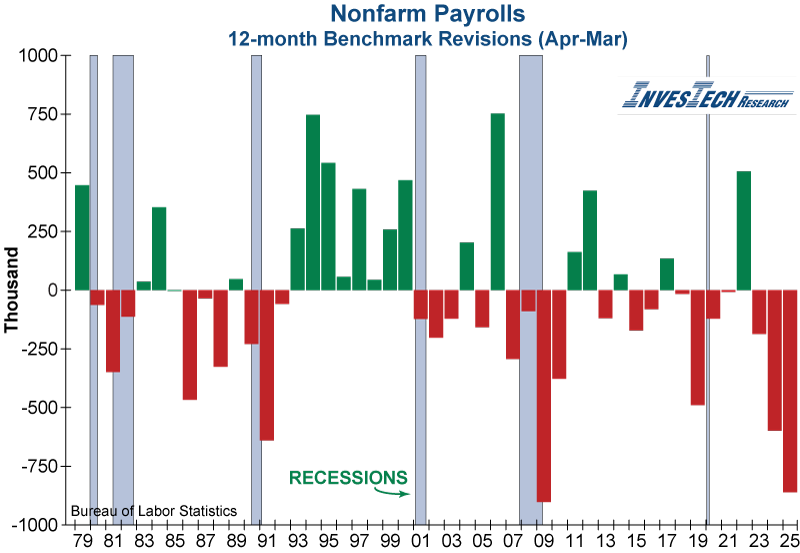
Read MoreRevision Shocker! Is “Employment” also sending a huge red flag?
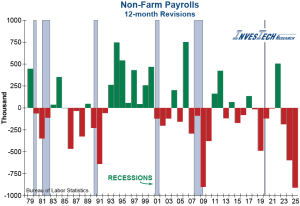
Each year the U.S. Bureau of Labor Statistics releases preliminary benchmark revisions to nonfarm payrolls for the 12 months ending in March of the current year.
Read MoreLabor Market Weakness Worsens
Last month’s Jobs Report shocked investors showing massive downward revisions in the number of jobs added.
Read MoreBad News from the Fed’s Favorite Inflation Gauge
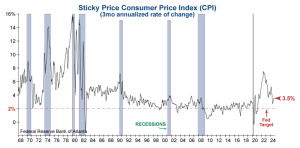
Although Federal Funds Futures still show an 87% probability of a Fed rate cut on September 17th, this latest inflation data remains far above the Federal Reserve’s 2% inflation target…
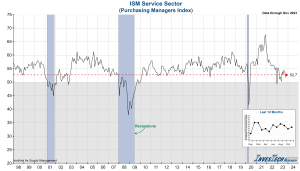
Read MoreU.S. Service Sector Hits a Snag
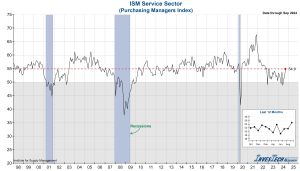
The Service Sector stumbled in July with the Institute for Supply Management (ISM) Services Purchasing Managers Index (PMI) coming in well below expectations at 50.1%.
Read MoreLabor Market Weakness Revealed
In our July Issue of InvesTech Research, we highlighted multiple signs that the labor market was likely weaker than headline figures implied…
Read MoreWidening Cracks in the Housing Market Foundation
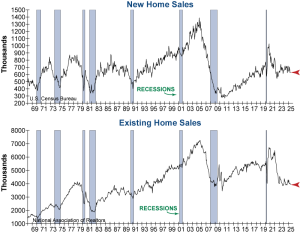
Both New and Existing Home sales data came out this week, revealing growing cracks in the housing market.
Read MoreThe Fed Battle Continues: Inflation Speeds Up
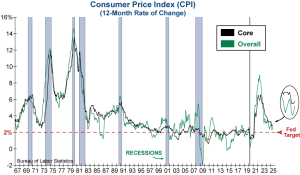
The Consumer Price Index (CPI) report for June showed reheating inflation.
Read MoreJob Market Resilience: Smoke and Mirrors?
The June Employment Report showed a slight unexpected improvement in labor market conditions as the unemployment rate fell from 4.2% to 4.1% and 147 thousand jobs were added.
Read MoreIs the Fed Losing the Labor Market Battle?
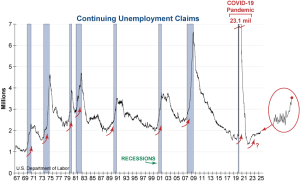
Continuing Unemployment Claims rose this week more than expected, surpassing their early June high.
Read MoreIs a Summer Cold Front Moving Toward the Job Market?
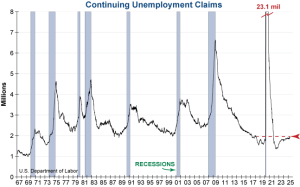
Continuing Unemployment Claims reached a 3.5-year high this week (and the highest since early 2018 outside of the pandemic), exposing cracks in the job market.
Read MoreServices Sector Falters Amid Growing Uncertainty
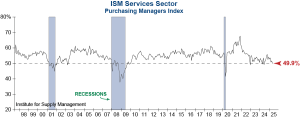
The Institute for Supply Management (ISM) Services Report showed weakness in the services sector as the Purchasing Managers Index (PMI) unexpectedly fell into contraction (<50%).
Read MorePending Home Sales Expose Growing Weakness
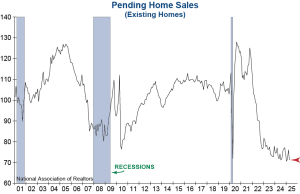
The Pending Home Sales Index plummeted in its latest release, falling -6.3% to its third lowest reading on record.
Read MoreConsumers Grow More Confident… But Storm Clouds May Be Looming
Consumer Confidence improved in May after five consecutive months of decline, increasing by 12.3 points.
Read MoreConsumer Sentiment – Just When You Thought It Couldn’t Get Worse

Consumer Sentiment from the University of Michigan came in below expectations this morning, falling to its second lowest level on record, and firing multiple torpedoes directly toward the bow of the U.S. economy.
Read MoreConsumer Confidence Plummets… More Trouble Ahead?
Consumer Confidence from the Conference Board plunged again in April, revealing a nosedive in consumers’ short-term outlook for income, business, and labor market conditions.
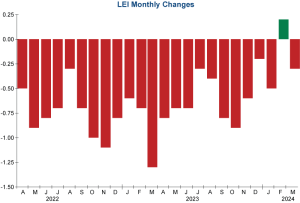
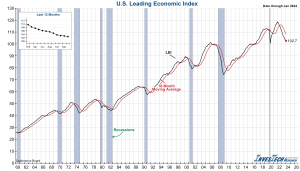
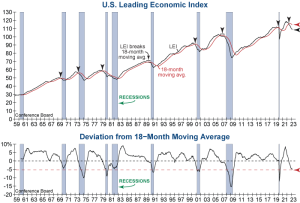
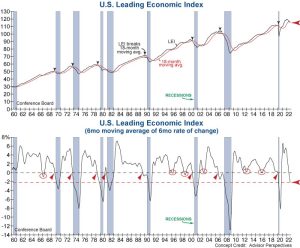
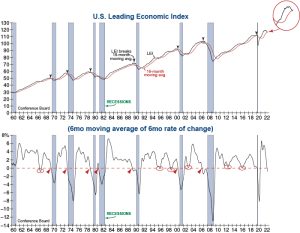
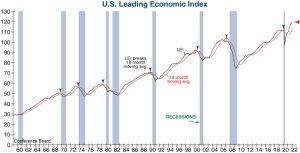
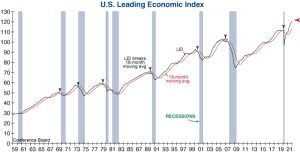
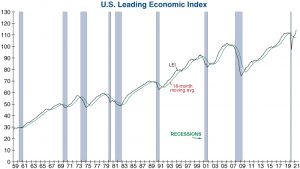
Read MoreCould the U.S. LEI “FINALLY” be right?

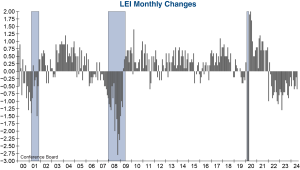
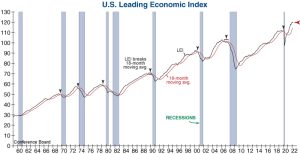
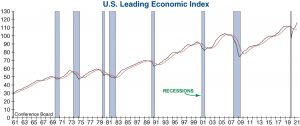
This morning’s March release showed the LEI fell 0.7 points from the prior month, suffering its largest drop since October 2023.
Read MoreConsumers Ring Warning Bells

The preliminary Consumer Sentiment report for April showed a broad decline in optimism across age, income, education, geographic region, and political affiliation.
Read MoreCritical Breakdowns in the “Critical 4”
Major market indexes tumbled today, with the S&P 500 closing down -12% from its peak in February and the Nasdaq Composite down -18% from its top last December.
Read MoreSlowing Growth and Escalating Prices… A Dangerous Combination
This morning’s report from the Institute for Supply Management on Manufacturing showed that the two-month recovery of manufacturing activity proved to be brief, with leading components flashing warning signals.
Read MoreTwo Torpedoes Directly into the Bow of the US Economy

Earlier this week, Consumer Confidence from the Conference Board revealed a dramatic deterioration in consumer attitudes across the board.
Read MoreNew Homes Continue to be the Weak Link of the Housing Market
This morning’s report on New Residential Sales from the U.S. Census Bureau seemed positive on the surface. However, it reveals ominous underlying weakness in the housing market.
Read MoreConsumer Sentiment Tumbles While Inflation Concerns Skyrocket

Interim Consumer Sentiment for March was far worse than expected with declines across the board, highlighting a stark reversal from the exuberance that has been driving the stock market and economy for the past few years.
Read MoreInvesTech’s Gorilla and AI Indexes tumble! Is major trouble dead ahead?

InvesTech’s proprietary Artificial Intelligence (AI) Index has fallen over 13% in the past 5 trading sessions, and our big-cap momentum Gorilla Index has tumbled 7.4%.
Read MorePending Home Sales Plunged to Record Low in January!
Pending Home Sales fell 4.6% in January and was dramatically worse than expected, adding to the widening cracks we have been highlighting in the foundation of the housing market.
Read MoreConsumer Attitudes Sour

Consumer spending has been the backbone of this economic expansion, however recent developments suggest that the consumer may be priming for a pullback.
Read MoreFriday Surprises Hit Wall Street!

The market was down sharply today with three times as many stocks declining as advancing on both the NYSE and Nasdaq exchanges. In addition, our Gorilla Index and Housing [Bubble] Bellwether Barometer each fell over 2%, and our Artificial Intelligence Index tumbled nearly 4%!
Read MoreInflation Picks Up Steam

This morning’s Consumer Price Index (CPI) report for the month of January came in hotter than expected and showed accelerating inflation, making the Federal Reserve’s inflation battle much more complicated...
Read MoreHousing Bubble – Did Something Just Go “Pop!”?

InvesTech’s Housing [Bubble] Bellwether Barometer, which tracks stocks with the greatest sensitivity to the housing market —such as homebuilders and mortgage financing companies— plunged decisively through its first support level today, signaling a serious warning flag for the housing market.
Read MoreA Ray of Sunshine? Or Imminent Storm Ahead…

The Institute for Supply Management (ISM) released their Manufacturing and Services Purchasing Managers Indexes (PMI) for January this week, revealing a cloudy economic landscape with both reasons for optimism and looming uncertainties.
Read MorePending Home Sales Fall in December, Revealing Continued Headwinds in the Housing Market

In January’s issue of InvesTech Research, we highlighted the widening cracks in the foundation of the housing market heading into 2025 – it looks like those cracks might be getting wider.
Read MoreConsumer Sentiment Falters as Inflation Concerns Reignite
The final reading for January Consumer Sentiment from the University of Michigan surprised to the downside, dropping 4% and reflecting consumer concerns about the current and future economy.
Read MoreBearish Distribution Triggers a Warning… Start Battening Down the Hatches
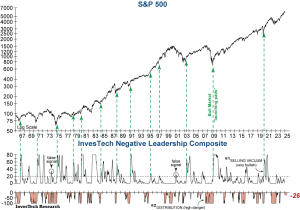
Bearish Distribution in InvesTech’s time-tested key indicator, the Negative Leadership Composite (NLC) has broken through -20. Distribution first emerged on December 20th at -5 and is now at -26.
Read MoreISM Services Expands: Why Good News May Still Be Bad News

Today’s report for the Institute for Supply Management's (ISM) Services Purchasing Managers Index (PMI) showed surprisingly strong expansion, but with a troubling increase in inflation pressures.
Read MorePost-election Rebound in Consumer Confidence May Be on the Rocks

The Conference Board’s Consumer Confidence slipped in December, disappointing forecasts. This was particularly surprising as the positive post-election euphoria and optimism for the future was expected to continue.
Read MoreBearish Distribution Appears! Will Warning Flags Continue to Mount?

Bearish Distribution in InvesTech’s time-tested indicator, the Negative Leadership Composite (NLC), has emerged for the first time in over a year.
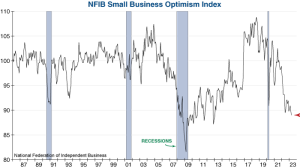
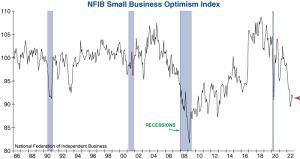
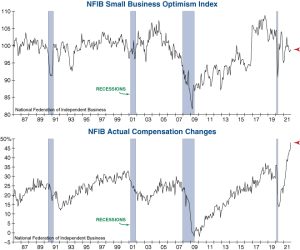
Read MoreSmall Business Optimism Surges in November, But Risks Remain…

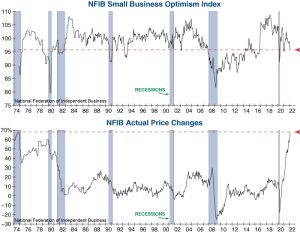
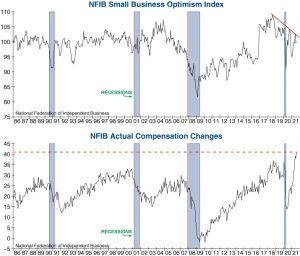
The latest Small Business Optimism Index from the National Federation of Independent Businesses (NFIB) surged eight points in November, its highest reading since June 2021.
Read MoreNew Home Sales Plummet in October Revealing Continued Cracks in the Housing Market

This morning’s New Home Sales report from the Census Bureau disappointed forecasts by falling sharply in October, suggesting trouble in the real estate market.
Read MoreSigns of Consumer Stress Heading into the Holidays

The seemingly strong consumer has been the lifeblood of this two year expansion. However, we continue to see signs that U.S. consumers are becoming increasingly stressed.
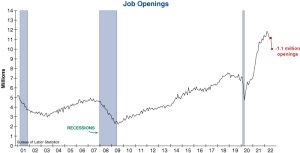
Read MoreJob Openings Reach Lowest Level Since January 2021
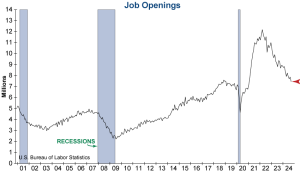
This morning’s Job Openings and Labor Turnover Survey (JOLTS) report from the Bureau of Labor Statistics for September showed a larger-than-expected decrease after last month's slight uptick.
Read MoreLeading Economic Index Disappoints Again

This morning’s Leading Economic Index (LEI) from the Conference Board fell yet again by 0.5% in September, which was notably worse than expected.
Read MoreThe Inflation Battle Is Not Over Yet
Today’s CPI data suggests the Fed’s goal of maintaining stable prices –and the all clear to deliver aggressive monetary easing– seems to be getting harder.
Read MoreJobs Report Throws Cold Water on Rate Cut Hopes

There is no doubt this jobs report is good news for those with soft landing hopes, but as shown by the move in the 10-year Treasury yield, strength in the labor market is beginning to throw cold water on potential interest rate relief for investors.
Read MoreISM Services Improves, but Employment and Inflation Remain Concerns
This morning, the Institute for Supply Management (ISM) released their Services Purchasing Managers Index (PMI) for September. Despite today’s more positive report, two subcomponents saw declines.
Read MoreConsumer Confidence Takes a Major Hit in September

Consumer Confidence dropped 6.5% in September as consumers become increasingly worried about the outlook for the U.S. economy. This dramatic downside surprise was the largest monthly drop since August 2021, with a decline in all five subcomponents.
Read MoreYield Curve Un-inverts – What Does It Mean?
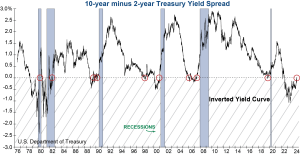
The spread between the 10-year and 2-year yields recently un-inverted. While this made headlines across financial media, many investors were left wondering what this actually means for the stock market and economy.
Read MorePending Home Sales Hits New Record Low

Today’s Pending Home Sales from the National Association of Realtors came in at 70.2 for July, its lowest on record since the series’ inception in 2001.
Read MoreLEI Slide Continues with a Big Miss in July
The Leading Economic Index (LEI) from the Conference Board fell again by 0.6% in July, which was much worse than expected. Weakness was shown to be widespread in non-financial components.
Read MoreUnemployment Rate Rises to 4.3%, Number of New Jobs Disappoints Forecasts
This morning’s Employment Situation report for July from the Bureau of Labor Statistics disappointed forecasts, with just 114K new jobs, a very small increase from a downwardly revised 179K the previous month.
Read MoreISM Manufacturing Weakens Further, Contracting Faster

The July report for the Manufacturing Purchasing Managers Index (PMI) from the Institute for Supply Management fell further into contraction territory as it declined 1.7 percentage points below the June figure. This is the Index’s fourth consecutive month below 50 and it has contracted for 20 out of the last 21 months.
Read MoreCracks Are Starting to Form in Existing and New Home Markets

Both Existing Home Sales from the National Association of Realtors and New Home Sales from the Census Bureau saw sales continue to decline and inventory rise and as housing shifts from a seller’s to a buyer’s market.
Read MoreUnusual Technical Anomalies? Or Warning Flags?
This past month has seen several highly unusual leadership and breadth divergences where seemingly positive developments have had questionable technicals under the hood. Even as we saw some resolution of these anomalies this week, yet another “first-ever” technical divergence emerged — this time looking at actual index performance.
Read MoreCPI Surprises, Falling More Than Expected
This morning, the Bureau of Labor Statistics released their June report for CPI. Both Headline and Core CPI came in lower than expected and below the previous month’s figures. Headline CPI for June registered at 3.0%, down from 3.3%, and Core CPI came in at 3.3%, down from 3.4% in May.
Read MoreISM Services Sector Falls Into Contraction For Second Time in Three Months

The Services Sector Purchasing Managers Index (PMI) from the Institute for Supply Management (ISM) fell 5.0 points to 48.8, missing forecasts and signaling contraction (<50.0) in the services economy.
Read MoreAnother Unprecedented Divergence… Are Fireworks Ahead?

Both the S&P 500 and Nasdaq Composite have had some seriously unusual negative divergences in breadth and leadership over the past few months as detailed in our the most recent issue of InvesTech Research.
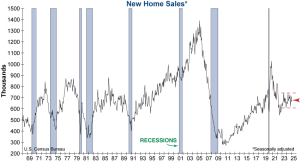
Read MoreNew Home Sales Plunge in May

This morning’s May report on New Home Sales from the Census Bureau fell 11.3% from the previous month.
Read MoreConsumer Confidence Weakens in June

This morning’s release of Consumer Confidence for the month of June from the Conference Board remained fairly muted, falling 0.9 points from last month.
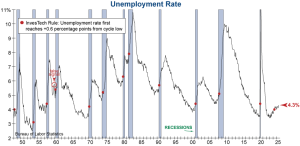
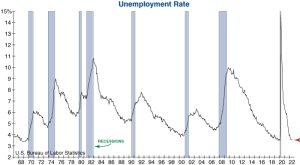
Read MoreUnemployment Rate Triggers a Rare Signal

The unemployment rate was released this morning surprising to the upside and reaching 4.0%. This is up 0.6 percentage points from the cycle low of 3.4%. This is noteworthy, as increases in the unemployment rate of 0.6 percentage points from a cyclical low have confirmed each of the last 12 recessions (see red dots on […]
Read MoreConsumer Confidence Increases in May, But Anxiety Remains

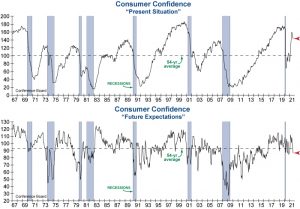
This morning’s Consumer Confidence for May from the Conference Board came in above expectations and was an increase of 4.5 points. The Present Situation Index increased by 3.5 points and the Expectations Index increased by 5.8 points. However, the Expectations Index remains below 80, which the Conference Board considers a recession signal threshold.
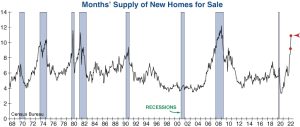
Read MoreMonths’ Supply of New Home Sales Rising Rapidly

This morning’s report on New Home Sales from the Census Bureau showed a 4.7% decrease from the previous month’s revised figure, but more notably, current inventory levels have reached 9.1 months of supply.
Read MoreLEI Issues Big Negative Surprise in April

The Leading Economic Indicator (LEI) from the Conference Board fell in April by 0.6% and has now declined 25 out of the last 26 months.
Read MoreConsumer Sentiment Plummets as Inflation Expectations Climb
Consumer Sentiment for May was released this morning and disappointed forecasts, falling nearly 13% from the previous month. The 9.8 index-point drop is the largest in almost three years and reiterates the concerns surrounding remaining consumer strength.
Read MoreISM Services PMI Sends a Rare Warning Signal as it Enters Contraction

This morning, the Institute for Supply Management (ISM) released their Services Purchasing Managers Index (PMI) for the month of April. For the first time in 17 months, the Services PMI has fallen into contraction territory (<50.0), coming in at 49.4.
Read More2 Key Economic Barometers Take a Sharp Turn for the Worse

Consumer Confidence was released this morning, highlighting serious concerns for the strength of this consumer-led economy. The Consumer Confidence report was pessimistic across the board.
Read MoreThe Fed’s Inflation Conundrum

The Federal Reserve is stuck between a rock and a hard place as recent economic data highlights inflationary pressures remain uncomfortably high. Personal Consumption Expenditures (PCE) inflation data for the month of March came in hotter-than-expected this morning.
Read MoreLEI Falls Again After Brief Improvement
The Leading Economic Indicator (LEI) from the Conference Board has fallen 0.3% in March after a brief, one-month improvement in February. It has declined 24 out of the last 25 months and continues to provide a recessionary outlook.
Read MoreMarch CPI Report Comes in Hot
The S&P 500 is experiencing a selloff and long-term bond yields are jumping as investors digest a hotter than expected CPI report.
Read MoreISMs Show Improvement

This week, the Institute for Supply Management (ISM) released their Purchasing Managers Index for both Services and Manufacturing for the month of March, which both saw improvement.
Read MoreInflation Data In-Line but Fed Wants to See More Progress
This morning’s Personal Consumption Expenditures (PCE) came in as expected, but isn't falling as quickly as the Fed would like, leaving the door open to potential surprises in either direction.
Read MoreLeading Economic Index Sees First Increase in Two Years

The Conference Board’s (CB) Leading Economic Index (LEI) increased 0.1% in February – its first monthly increase since February 2022.
Read MoreAnother Hotter-Than-Expected Inflation Print
This morning’s Headline CPI print came in hotter than expected, going from 3.1% to 3.2% year-over-year (YoY) while Core CPI ticked down from 3.9% to 3.8% YoY but was still higher than consensus.
Read MoreConsumer Confidence Retreats in February
The Conference Board’s Consumer Confidence Index fell to 106.7 in February from a downwardly revised 110.9 (from 114.8) in January.
Read MoreLEI Falls for 23rd Consecutive Month in January
This morning’s release of the Conference Board’s Leading Economic Index (LEI) for January disappointed expectations and fell for the 23rd consecutive month, its second longest stretch in the series’ history.
Read MoreThe Last Mile to 2% Gets Bumpy
Yesterday’s report for January Consumer Price Index (CPI) came in higher than expected at 3.1% year-over-year, but still lower than the 3.4% year-over-year (YoY) reading for December.
Read MoreRegional Fed Manufacturing Surveys Show Significant Weakness
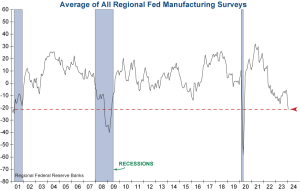
Today’s Texas Manufacturing Outlook Survey from the Federal Reserve Bank of Dallas showed further contraction in January after some improvement in December and was a significant downside surprise compared to forecasts.
Read MorePending Home Sales Jump in December – Not So High
This morning, the National Association of Realtors (NAR) released their December report for Pending Home Sales. Sales in December were up 8.3% from November and up 1.3% from December 2022. Today’s “surprising” jump in Pending Home Sales doesn’t seem like the huge improvement it’s made out to be...
Read MoreU.S. Leading Economic Indicator Contracts for 22nd Consecutive Month
Yesterday, the latest data for the Conference Board’s Leading Economic Indicator (LEI) was released for December. December saw a 0.1% decrease for its 22nd consecutive month after falling 0.5% in November. Benchmark revisions were made going back to the start of the series.
Read MoreEmployment Strength: Weaker Than Meets the Eye
Recent releases have highlighted apparent strength in the employment market, but digging deeper we find things may not be as rosy as they seem…
Read MoreISM Manufacturing and Job Quits & Hires Slide Past Prepandemic Levels
Today's economic news included the ISM Manufacturing PMI release for December and the Job Openings and Labor Turnover report. Minutes from the last FOMC meeting were released as well.
Read MoreHome Prices at All-Time Highs as Pending Home Sales Remain at All-Time Lows
This week’s economic news has been light due to the shortened holiday week. However, housing market data continues to highlight extreme dichotomies.
Read MoreYear-End Housing Update
A slew of economic releases point to a surprising upturn in housing activity. However, as affordability remains a serious concern, we wonder how long this euphoria can last…
Read MoreInflation Remains Firm as Small Businesses Struggle
Both CPI and NFIB's Small Business Index were released this morning for November. Inflation remained firm as small businesses continue to struggle...
Read MoreJob Openings and Labor Turnover (JOLTS)
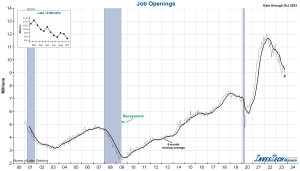
This morning’s JOLTS report for October registered 8.773 million job openings, which was down notably from September’s downwardly revised 9.350 million openings.
Read MoreISM Services
The latest ISM Services Index for November came in at 52.7%, slightly above expectations and 0.9 percentage points above the October reading of 51.8%. The ISM Services Index now sits at the mid-point of this year’s readings, which have ranged from 50.3 to 55.2
Read MorePending home sales hit a record low

Pending Home Sales from the National Association for Realtors hit a record low in October, reaching 71.4 – the worst reading in its 22+ year history...
Read MoreConference Board Consumer Confidence
This morning’s Consumer Confidence Index for November came in at 102.0, up from a downwardly revised 99.0, slightly better than forecast, and its first improvement in three months.
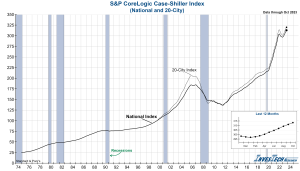
Read MoreS&P CoreLogic Case-Shiller Home Price Index
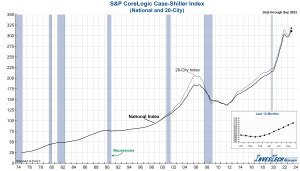
The latest S&P CoreLogic Case-Shiller National Home Price Index (not seasonally adjusted - NSA) for September saw a 3.9% increase year-over-year (YoY), up from a 2.5% YoY change the previous month.
Read MoreNew Home Sales
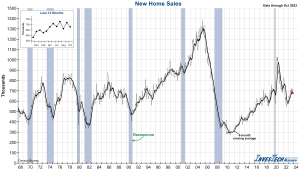
Sales of new single-family homes for the month of October came in at 679,000, down from a revised 719,000 for September and lower than expected. This represents a 5.6% decrease month-over-month, but a 17.7% increase from this time last year.
Read MoreUniversity of Michigan Consumer Sentiment
The November Final reading for the Consumer Sentiment Index came in at 61.3, down 3.9% from the October Final reading and its fourth consecutive decline.
Read MoreProducer Price Index (PPI)
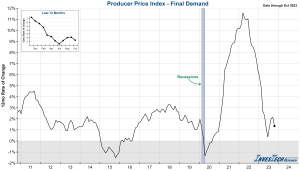
The latest Headline PPI FD for October came in at -0.5% month-over-month (MoM), down significantly from 0.4% in September. PPI is up 1.3% on a year-over-year (YoY) basis, its first deceleration in four months.
Read MoreLatest macroeconomic data reiterates the case for a hard landing ahead
Recent macroeconomic reports have shown broad-based weakness as the U.S. economy remains on a collision course with recession...
Read MorePremier small-cap index breaks to new bear market low!

The Russell 2000 Index has broken below its June 2022 bear market low as technical damage continues to accumulate...
Read MoreDistribution in our Negative Leadership Composite falls to -100!
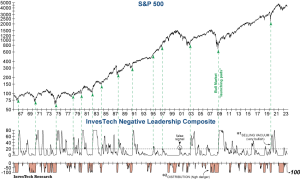
With Distribution falling to -100 in our Negative Leadership Composite, caution is warranted going forward...
Read MoreInvesTech’s flagship indicator breaches a critical threshold
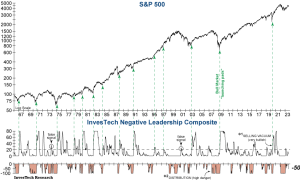
Our Negative Leadership Composite has registered an important warning flag in a sign of rising market risk...
Read MoreThe consumer squeeze approaches a potential breaking point…
With U.S. consumers remaining under significant pressure, a key indicator is nearing a critical warning level...
Read MoreThe bear reawakens? NLC triggers bearish Distribution (again)
With Distribution reemerging within our Negative Leadership Composite, the bear market may be close to regaining control...
Read MoreInflationary pressures start to reaccelerate
While inflation data has made positive progress over the past year, multiple indicators show that pricing pressures have started to reemerge...
Read MoreCash is Not Trash: How to make the most of your cash allocation

Cash is a critical part of every "safety-first" investor's portfolio, and it pays to know how to get the most out of this key holding...
Read MoreIs air being let out of the speculative bubble… again?

Speculation reemerged in 2023, however there are early signs that the latest fervor may be fading...
Read MoreSmall business struggles persist…
The National Federation of Independent Business (NFIB) reported that their Small Business Optimism Index improved by 0.9 points in July, yet the Index remains at a historically depressed reading of 91.9...
Read MoreU.S. economy – soft landing or recession ahead?
While investors increasingly expect a soft landing for the U.S. economy, the economic data still paints a worrisome picture...
Read MoreAs consumer attitudes rebound, a different warning flag emerges…
While the recent rebound in Consumer Confidence is encouraging, other leading indicators paint a far less optimistic picture...
Read MoreThe Fed’s burden shifts from inflation to employment
With inflation pressures easing in recent months, the strong employment data has started to play a larger role in the Fed's monetary policy decisions...
Read MoreJobless claims rise to a concerning level. Is the economy’s stronghold fading?

Initial claims for unemployment have risen significantly in recent months, signaling that labor market strength may be fading...
Read MoreS&P 500 enters overbought territory
Wall Street has celebrated the S&P 500 reaching “bull market” status by gaining +20% from its October low, however this rally has also led to overbought signals in multiple indicators...
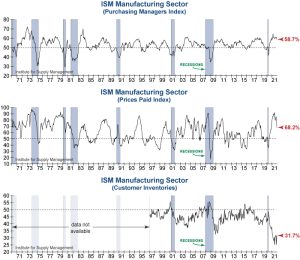
Read MoreService & Manufacturing Sectors Show Signs of Slowing Demand
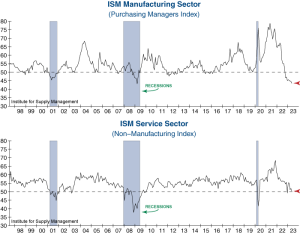
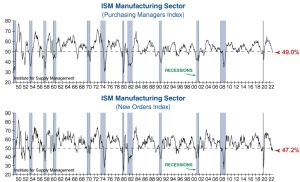
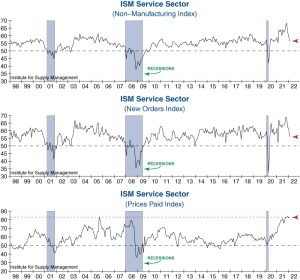
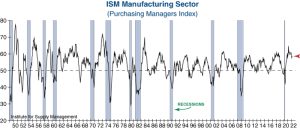
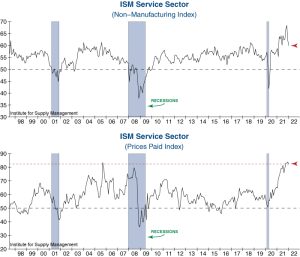
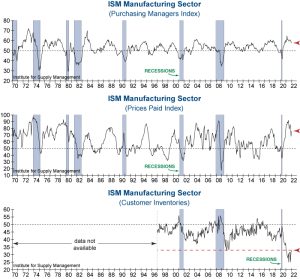
Both Institute for Supply Management (ISM) Purchasing Manager’s Index (PMI) for Manufacturing and Non-Manufacturing (Services) have shown general deterioration over the last 18 months.
Read MoreDebt Limit Showdown – Here’s What to Watch
Once again, all eyes on Wall Street are fixed on the debt limit showdown and there is a steady stream of headlines and news reports about the impending crisis that is quickly approaching.
Read MoreSmall business optimism sinks to decade low
The NFIB Small Business Optimism Index fell to the lowest level in a decade in April as small business owners prepare for tough times ahead...
Read MoreRegional Fed Manufacturing Surveys continue to spell trouble
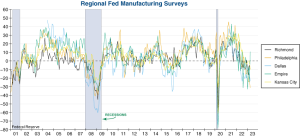
Regional manufacturing surveys from the Federal Reserve continue to languish as economic challenges persist...
Read MoreLeading Economic Index continues to falter
The Conference Board's Leading Economic Index has fallen for the 12th straight month as it further solidifies its recessionary warning signal...
Read MoreLatest Inflation Numbers Seem Hopeful, But Be Careful What You Wish For
While falling inflation seems like a positive development, drops of this magnitude often occur when economic conditions are collapsing and there is little the Fed can do to save the day...
Read MoreSmall businesses remain under pressure
The NFIB Small Business Optimism Index declined in March to remain at a historically low reading...
Read MoreCoppock Guide “ticks” upward… but is it a signal?
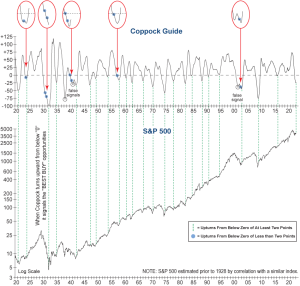
The Coppock Guide ticked higher in March, yet there are many important factors that can help put this positive signal into context...
Read MoreBellwether Index registers a warning flag
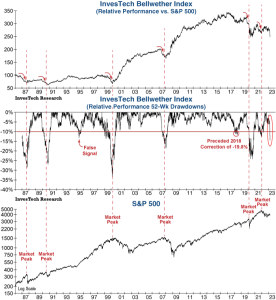
The sudden underperformance of our Bellwether Index has triggered a warning flag that should not be ignored...
Read MoreThe Fed is stuck between a rock and a hard place
The FOMC finds itself in a tough position as inflationary forces persist while the banking system has started to show some vulnerabilities...
Read MoreBearish Distribution reemerges!
The reemergence of Distribution in our Negative Leadership Composite signals that the bears may have regained control of the stock market...
Read MoreMortgage applications sink to a 28-year low!
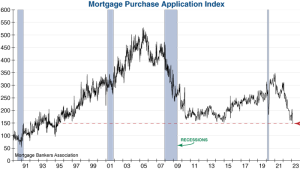
Homebuyer demand continues to deteriorate as mortgage rates remain near multi-decade highs...
Read MoreLatest inflation report points to further Fed rate hikes ahead
Persistent inflationary pressures continue to keep the Federal Reserve on a tightening path...
Read MoreSelling Vacuum signal emerges for first time since 2020
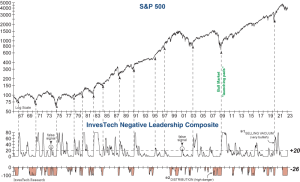
Our Negative Leadership Composite has started to generate a positive signal as the technical data continues to improve...
Read MoreWill the ‘real’ GDP please stand up?
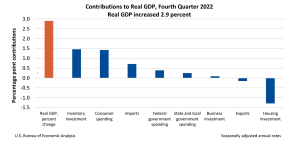
The Advance Estimate for Q4 2022 Real GDP came in at 2.9%, down from 3.2% for Q3 but better than consensus. This may seem like a win against recessionary warning flags, but it doesn’t tell the whole story.
Read MoreLeading Economic Index continues its slide
The worsening decline in the Leading Economic Index means that a U.S. recession may have already arrived…
Read MoreDebt Limit Showdown! – Will the U.S. Government Default
The headlines are progressively warning of dire consequences if the U.S. Government defaults… We say: don’t panic!
Read More[Potentially] bullish Breadth Thrust emerges from the bear market lows
A breadth thrust has emerged for the first time since June 2020, a technical development deserving of careful consideration...
Read MoreService Sector shockingly plunges into contraction
The ISM Services Index suffered its third largest drop in history in December and is another indicator sending a decisive recession warning flag...
Read MoreLeading Economic Index points to hard times in 2023
The Leading Economic Index suffered its worst decline since the pandemic, as recession appears to be quickly approaching...
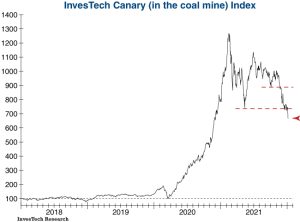
Read MoreCanary Index leads the break to new lows
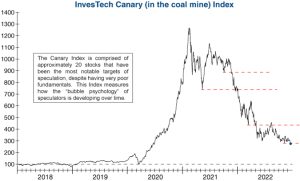
Our Canary (in the coal mine) Index breaking to new lows could be a prelude to what lies ahead for the broader market...
Read MoreInflation eases, yet challenges for the Fed remain
The Consumer Price Index continued to ease in the latest report, yet one key measure shows that wages remain a persistent inflationary force...
Read MoreManufacturing falls into contraction for the first time since the pandemic
The ISM Manufacturing Index fell more than expected in November and is raising a recession warning flag...
Read MoreConsumers grow more pessimistic heading into the holidays
Consumer Sentiment remained at one of the worst readings in its 60+ year history in November as inflation expectations rebounded and labor market conditions start to deteriorate…
Read MoreLeading Economic Index suffers sharpest drop since pandemic-induced recession
The Conference Board's Leading Economic Index declined for the 8th straight month as it solidifies its recessionary warning flag.
Read MoreSmall business optimism remains downtrodden heading into year-end
Small business owners remain pessimistic as they contend with many challenges, including persistent inflation pressures and falling customer demand.
Read MoreStrong wage growth complicates the Fed’s inflation fight
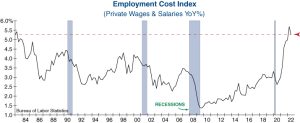
The Employment Cost Index remained at a historically high level in Q3, which is further pressuring the Fed to remain on a tightening course.
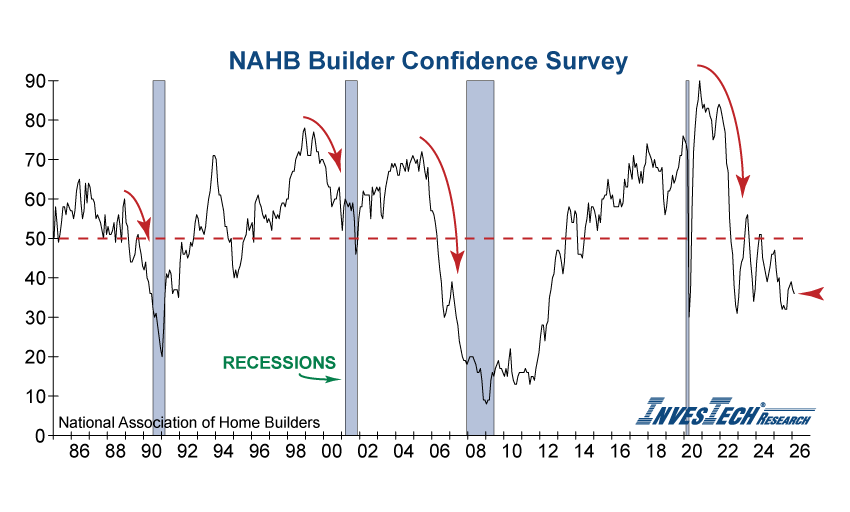
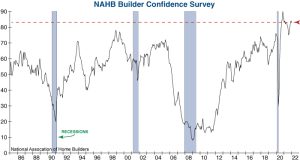
Read MoreHomebuilders warn of more pain ahead
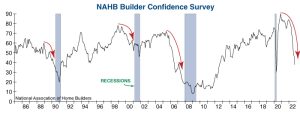
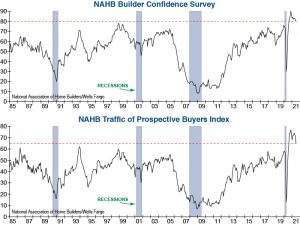
NAHB Builder Confidence declined for a record 10th month in a row in October as housing conditions continue to deteriorate...
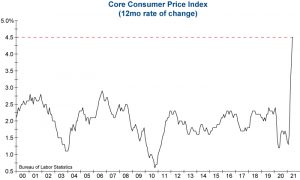
Read MoreCore inflation reaches a new 40-yr high
The Core Consumer Price Index jumped to the highest level since 1982 in September, and broadening inflation pressures show that today's inflation problem is far from over...
Read MoreGorilla Index’s breakdown is a bad omen
Our Gorilla Index has plunged through its lower support level and is making new lows, indicating that the broad market may be soon to follow...
Read MoreThe labor market weakens, but key data will keep the Fed on a tightening path…
There is growing evidence of weakness in the U.S. labor market, yet data which matters most to the Federal Reserve is keeping them on a tightening course...
Read MoreSoaring interest rates point toward further Fed tightening
Skyrocketing interest rates have pushed stocks to new lows and indicate that the Federal Reserve still has a ways to go before they can stop tightening monetary policy...
Read MoreLeading Economic Index solidifies its recession warning
With the Conference Board's Leading Economic Index declining for the sixth straight month, recession is looking increasingly inevitable...
Read MoreHas a pinhole been put into this housing bubble?
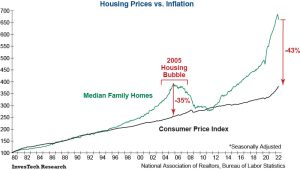
It is no secret that the housing market has gone ballistic over the past two years. Yet, there is now growing evidence that extremes in the housing market are coming unwound...
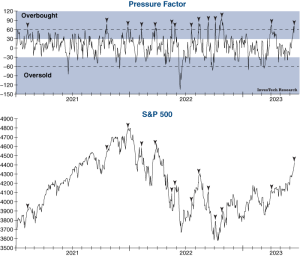
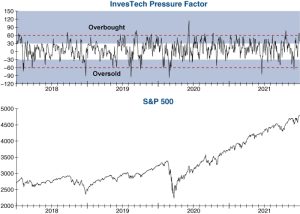
Read MorePressure Factor reaches a historically extreme level…
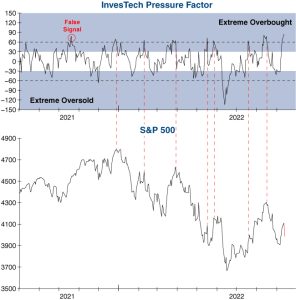
Our short-term Pressure Factor just reached the second most overbought level of the past decade - a big potential headwind for the market in the days or weeks ahead...
Read MoreLabor market expands but shows increasing weakness in August…
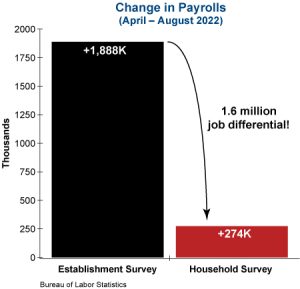
Headlines are cheering that 315K jobs were added in August, but the labor market looks a lot less stable when we look below the surface...
Read MoreLatest housing data – look out below!
New home sales continued to plunge in July as the faltering housing market represents a growing risk to the U.S. economy.
Read MoreBreadth Thrusts: What is this bullish confirmation tool telling us today?
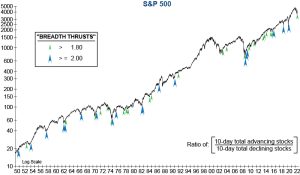
Breadth thrusts have been one of the most reliable confirmations that a new bull market has begun, so is this tool validating the recent stock market rally?
Read MoreHousing risks continue to accumulate
Homebuyer traffic has continued to collapse in the midst of this affordability crisis, increasing the risk of a hard landing for housing...
Read MoreInflation declines, but investors shouldn’t celebrate just yet…
Equities rallied on the decline in inflation last month, but key data shows it may not be the bullish development many are hoping for...
Read MoreLatest employment data appears strong, but there’s a catch…
Today's employment report was stronger than expected, but leading indicators suggest that this strength may not last for long...
Read MoreBroadening inflation keeps pressure on the Fed
A key measure shows that inflation broadened by the largest amount on record in June – increasing pressure on the Fed to regain control over inflation…
Read MoreForget the backward-looking recession debate – the worst likely lies ahead for the US economy…
Many are debating whether or not the U.S. is in recession after real GDP growth declined for the second straight quarter. More important to investors, however, are the concerning signals being sent by the leading economic data...
Read MoreLeading Economic Index verging on recessionary signals
The Conference Board's Leading Economic Index has declined for the fourth straight month and is now on the brink of giving multiple recessionary warning flags...
Read MoreHomebuilder confidence posts second-largest plunge on record in July
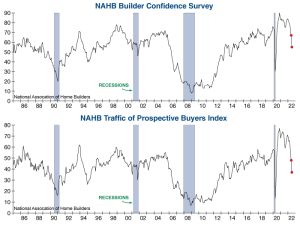
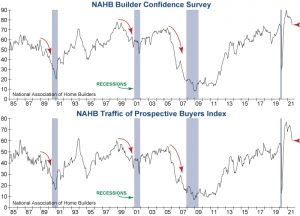
Builder Confidence from the National Association of Home Builders (NAHB) cratered in July as unprecedented affordability challenges weigh on homebuyer demand...
Read MoreNFIB Small Business Survey – Just when you thought it couldn’t get any worse…
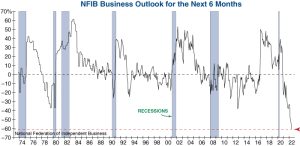
NFIB Small Business Optimism plunged further in June as recessionary warning flags continue to emerge...
Read MoreRecession risk rises as jobless claims reach worst level in eight months
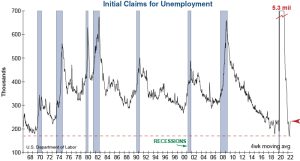
Jobless claims have surged to an 8-month high as another recessionary warning flag emerges...
Read MoreManufacturing tumbles in June – confirming a likely U.S. recession
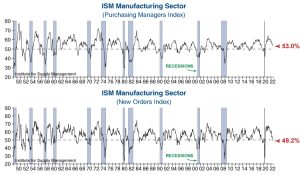
The ISM Manufacturing Index declined further in June, and an internal component suggests that the risk of recession is rising rapidly...
Read MoreConsumers’ outlook darkens as inflation expectations surge to new highs
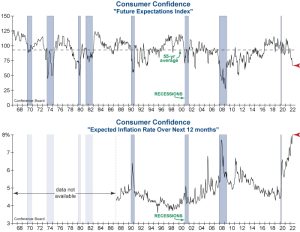
Consumers’ outlook for the future continues to deteriorate as inflation expectations surge to new highs – is inflationary psychology is becoming ingrained in the minds of consumers?…
Read MoreLEI – On a collision course with recession?
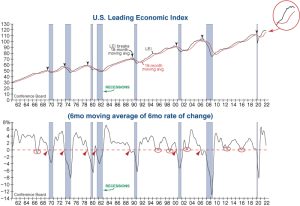
The Conference Board's Leading Economic Index (LEI) has fallen for the third straight month and is suggesting that an economic slowdown and possible recession may be in store for the U.S. economy.
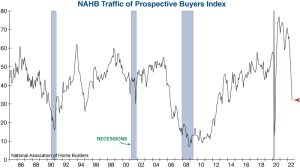
Read MoreTraffic of prospective home buyers plunges as affordability challenges worsen

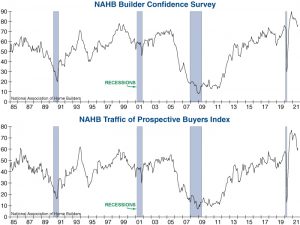
NAHB Traffic of Prospective Buyers collapsed further in June as soaring mortgage rates and deteriorating affordability have put the housing market in a vulnerable position...
Read MoreInflation unexpectedly jumps to a 40-yr high, sending Consumer Sentiment to a 70-yr low!
As inflation has proven to be stubbornly persistent, consumers have become the most pessimistic of any time since 1952 as recession risks start to mount...
Read MoreService sector slows to a two-year low
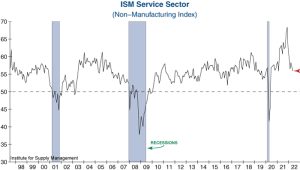
The ISM Services Index has fallen to the lowest level since May 2020, but the fact that it remains in expansion territory will pressure the Fed to continue tightening in the months ahead.
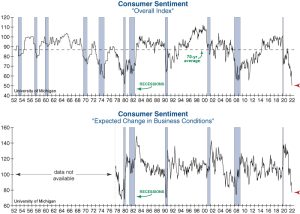
Read MoreConsumer Sentiment hits a new low in a sign of caution for the U.S. economy
As Consumer Sentiment becomes more and more depressed, the U.S. economy is in a vulnerable position with spending beginning to soften...
Read MoreLatest data flashing “RED” for the housing market!
Just released housing data reveals a sharp drop in new home sales and surging inventory – confirming a probable “hard landing” ahead for housing…
Read MoreTraffic of prospective buyers collapses – an early warning flag for the housing market
NAHB Traffic of Prospective Buyers fell by the second-largest amount on record in May, indicating that the housing market is now skating on thin ice...
Read MoreMargin Debt solidifies our ‘red flag’ warning
Margin debt continued to decline in April and is confirming that a longer-term stock market peak is likely in place...
Read MoreInflation cools slightly, but its persistence will keep the Fed on a tightening path
Inflation ticked lower in April, but its persistence surprised many and is likely to keep the Fed tightening monetary policy in the months ahead.
Read MoreCrypto miners break critical support. Could Bitcoin be next?
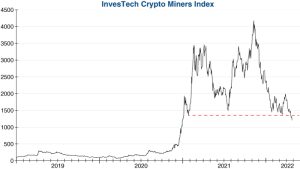
[Updated May 9] Earlier this year, we began tracking 10 of the leading crypto mining stocks to warn of a potential loss of exuberance surrounding the crypto-mania...
Read MoreResilient ISM Surveys show signs of initial weakness
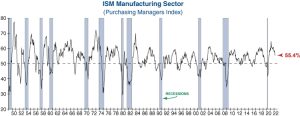
While the ISM surveys remain at historically strong levels, the combination of high prices and falling demand could weigh on companies in the months to come...
Read MoreThe battle between consumer confidence and inflation “heats” up
Consumer Sentiment rebounded in April after suffering its second worst 11-month skid in history... however, one important component has reached its most worrisome level in over 40 years.
Read MoreGorilla Index tests another critical support level
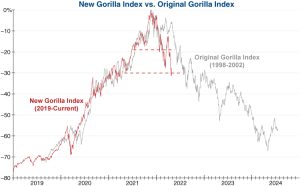
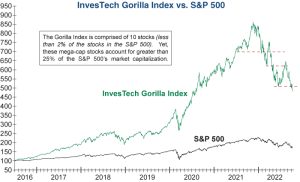
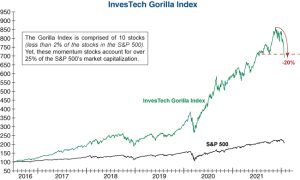
Following the pandemic-induced crash of 2020, we developed our new Gorilla Index as we recognized that just 10 mega-cap momentum stocks accounted for a disproportionately large 27% weight in the S&P 500 Index...
Read MoreThe Leading Economic Index advances but it’s not all good news…

The Conference Board’s Leading Economic Index (LEI) gained 0.3% in March, indicating that economic growth is likely to continue in the months ahead...
Read MoreSoaring mortgage rates hit the brakes on home buyer traffic

Traffic of Prospective Buyers from the National Association of Home Builders (NAHB) fell for the fourth straight month after this month’s six point decline.
Read MoreMargin debt craters in March!

Margin debt has joined the ranks of emerging warning flags after falling significantly in March.
Read MoreInflation surges higher, taking small business optimism to new lows
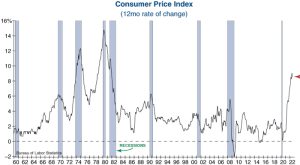
The Consumer Price Index (CPI) surged to 8.5% on a year-over-year basis in March, the highest reading since 1981.
Read MoreService sector shows resilience despite record inflation challenges
The ISM Services Index increased by 1.8 points to a reading of 58.3 in March, its first gain in four months.
Read MoreManufacturing slows as prices remain hot
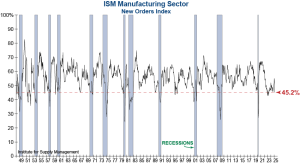
The ISM Manufacturing Index fell to an 18-month low in March, due largely to new orders falling by the fastest clip since the COVID-19 induced recession in early 2020.
Read MoreInflation sets (another) record
Personal Consumption Expenditures (PCE) climbed to +6.4% in February, its 15th straight monthly gain which ties the prior record set in 1980.
Read MoreConsumer Sentiment craters as inflation expectations hit a 41-year high
The Consumer Sentiment survey from the University of Michigan plunged further below its pandemic lows in March as inflation expectations surged to the highest level since 1981.
Read MoreLEI nudges higher in February but risks to growth remain
The Leading Economic Index (LEI) from the Conference Board edged higher by 0.2% in February, yet the gain was not enough to offset half of the prior month’s -0.5% loss.
Read MoreInflation surges to a new high ahead of next week’s Fed meeting

The overall Consumer Price Index (CPI) jumped +0.4% to +7.9% in February, the highest reading since January 1982.
Read MoreSmall Business Optimism sinks as price hikes hit a record high
The Small Business Optimism Index from the National Federation of Independent Business unexpectedly fell to the lowest level in over a year as surging inflation and labor shortages continue to be headwinds.
Read MoreService sector unexpectedly slows to a 12-month low
The ISM Services Index dropped to a reading of 56.5 in February versus economists’ expectations for an increase to 60.9.
Read MoreManufacturing improves after a three-month skid
The ISM Manufacturing Index jumped by one point and remains at an historically strong reading of 58.6 after having contracted for the previous three months.
Read MoreInflation surges to a 40-year high
Personal Consumption Expenditures (PCE) rose to +6.1% in January, the highest reading in 40 years.
Read MoreOur leading housing index breaks below initial support
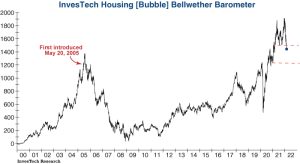
Our Housing [Bubble] Bellwether Barometer has broken under its initial support level as mortgage rates have spiked to 3.9%.
Read MoreLeading economic indicators slow unexpectedly to start the year
The Leading Economic Index (LEI) from the Conference Board fell by -0.3% in January, notably lower than economists’ expectations for a +0.3% increase.
Read MoreMargin debt plunges in January
Margin debt has joined the list of bear market warning flags as it cratered to start the year.
Read MoreInflation takes a big hit on Sentiment!
Consumer Sentiment from the University of Michigan unexpectedly cratered to an 11-year low in February as inflation continues to weigh heavily on the consumer.
Read MoreSmall Business Optimism falls further as inflation soars
Small Business Optimism from the National Federation of Independent Business fell to an 11-month low in January as inflation continues to be challenging
Read MoreService Sector loses some steam, but increases pressure for rate hikes ahead
The ISM Services Index declined to start 2022, as persistent labor and supply chain shortages weighed on the measure.
Read MoreManufacturing softens for the third straight month
The ISM Manufacturing Index continued to moderate in January, as its third consecutive decline brought it down to a 16-month low.
Read MoreConsumer Sentiment hits new lows on inflation concerns
Consumer Sentiment from the University of Michigan fell further below its pandemic lows this month as inflation concerns continue to mount.
Read MoreThe InvesTech Gorilla Index loses technical support
During the final years of the 1990s Tech Bubble, we observed an interesting dynamic where a relatively small number of mega-cap stocks became responsible for the majority of the stock market’s advance.
Read MoreNew highs in the Leading Economic Index come with a warning from the Conference Board…
The Conference Board’s Leading Economic Index (LEI) improved by 0.8% in the final reading of 2021, with only one of its ten components contributing negatively...
Read MoreHomebuilder confidence dips – has it peaked for this cycle?
NAHB Builder Confidence declined by one point to a reading of 83, yet the measure is still at a very strong historical level.
Read MoreInflation continues to hit consumer attitudes
The University of Michigan’s measure of Consumer Sentiment declined slightly in January’s preliminary reading to reach the second lowest level of the past decade.
Read MoreConsumer prices rise at fastest pace since 1982
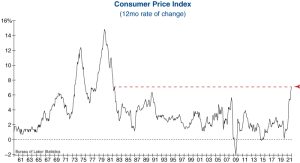
Inflation as measured by the Consumer Price Index (CPI) climbed to +7.0% in December, the highest reading in nearly 40 years and a far cry from last December’s print of +1.4%.
Read MoreSmall business optimism inches higher but inflation continues to weigh
NFIB Small Business Optimism gained just 0.5 points in December to remain at a relatively depressed reading of 98.9.
Read MoreCanary Index plunges below critical support
Our InvesTech Canary (in the coal mine) Index has been testing its critical support level for the last few weeks. On Wednesday, the Index -7% loss definitively broke support.
Read MoreService sector is hampered by Omicron

The services sector finished 2021 on a significantly weaker note, as the ISM Services Index fell to a reading of 62.0 versus expectations of 67.0.
Read MoreManufacturing disruptions start to moderate
The ISM Manufacturing Index moved lower by 2.4 points in December, yet the Index remains at a historically strong reading of 58.7, as many of the supply/demand imbalances in the manufacturing sector began to normalize last month.
Read MorePressure Factor reaches overbought extreme
Our InvesTech Pressure Factor, a technical tool that indicates how overbought or oversold the market is in the short term, reached an extreme overbought reading of + 69 earlier this week.
Read MoreConsumers find a little bit of holiday cheer
Consumer Sentiment from the University of Michigan improved by 3.2 points in the final reading of 2021, primarily because the outlook of low-income households jumped as they begin to realize the benefits of the ongoing labor shortage in the form of wage growth.
Read MoreMore strong inflationary data coming down the chimney
Personal Consumption Expenditures (PCE) rose to 5.7% in November, the highest reading in nearly 40 years.
Read MoreLeading economic indicators continue to advance
The Conference Board’s Leading Economic Index (LEI) continued to move higher in November on broad strength.
Read MoreCanary Index testing critical support level
Our InvesTech Canary (in the coal mine) Index recently plunged below initial support and proceeded to close below its critical support level for the first time yesterday.
Read MoreProducers continue to get squeezed
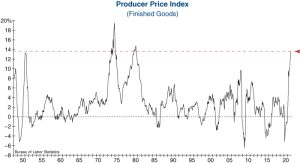
The Producer Price Index (PPI) for Finished Goods continued to surge in November and has now increased by +13.6% from a year ago.
Read MoreInflation soars to a 40-year high
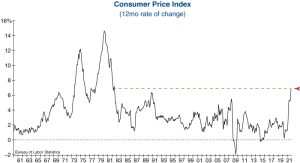
The Consumer Price Index surged to 6.8% in December, the highest level in nearly 40 years.
Read MoreInvesTech Negative Leadership Composite Triggers Distribution
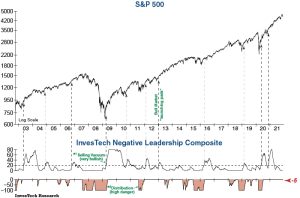
For the first time since the 2020 COVID-19 Crash, our Negative Leadership Composite (NLC) has started showing bearish Distribution.
Read MoreManufacturers show strength despite persistent challenges
The ISM Manufacturing Index ticked higher to a reading of 61.1 in November, keeping it at a historically strong reading.
Read MoreSurging prices weigh on the minds of consumers heading into the holiday season
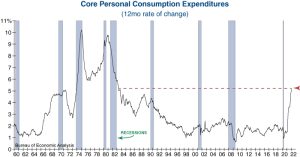
Core Personal Consumption Expenditures (PCE), which excludes volatile food and energy prices, climbed even further beyond the Federal Reserve’s 2.0% inflation target in October.
Read MoreBorrowing on Margin Soars as Speculation Re-engages
Margin debt surged to new highs in October in a clear indication that speculation remains alive and well in the stock market.
Read MoreLeading economic indicators keep on rolling – what does it mean for the equity market?
The Conference Board’s Leading Economic Index (LEI) reached a record high for the seventh straight month in this morning’s release, suggesting that economic strength will continue into 2022.
Read MoreHomebuilder optimism regains its footing
After sliding for much of this year, NAHB Builder Confidence continues to rebound and remains above its pre-pandemic highs.
Read MoreConsumer Sentiment falls to the lowest level in a decade
November’s preliminary reading of Consumer Sentiment fell further below its pandemic lows due to intensifying inflation fears.
Read MoreInflation accelerates and broadens at an alarming pace

The Core Consumer Price Index (CPI) -which excludes food and energy prices- soared to another 30-year high in October as pricing pressures continue to mount.
Read MoreInflation insights from the corporate trenches…

As the inflation debate rages on, we explore what CEOs and corporate executives of Fortune 500 companies are seeing on the ground floor.
Read MoreA record high for the services sector, but not as strong as it appears…
The ISM Service Sector surged to the highest level in its 24-year history last month due to the combination of strong consumer demand and supply chain disruptions.
Read MoreA tug of war between manufacturing demand and supply chain challenges
The ISM Manufacturing Index ticked down by 0.3 points in October to remain near one of the highest readings of the past 50 years.
Read MoreInflation puts the Fed further behind the eight-ball
Core Personal Consumption Expenditures (PCE), the preferred inflation measure of the Federal Reserve, climbed to 3.64% last month to remain at the highest level in over 30 years.
Read MoreConsumer Sentiment gets hit hard by inflation psychology
The University of Michigan’s measure of Consumer Sentiment declined in October as inflationary fears pushed consumers’ attitudes back below pandemic levels of a year ago.
Read MoreNew home sales jump in spite of record price increases
New home sales of 800,000 in September was notably higher than economists’ expectations and was the largest month-over-month increase since July of 2020.
Read MoreConsumer Confidence stabilizes yet inflation expectations become even more extreme
Consumer Confidence rose modestly in October after having fallen for the four months prior, bolstered primarily by declining COVID-19 cases.
Read MoreLeading economic indicators rise, but at a much slower pace…
The Conference Board’s Leading Economic Index (LEI) increased to another record high in September, yet last month’s growth of 0.2% missed economists’ expectations and was the second slowest reading since last year’s COVID-induced recession.
Read MoreProducers feel the pinch
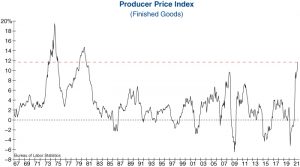
The Producer Price Index (PPI) for Finished Goods climbed from 10.2% to 11.7% in September, the highest reading since November of 1980.
Read MoreInflation just won’t quit
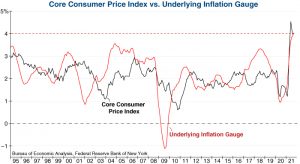
The Core Consumer Price Index (CPI), which excludes food and energy prices, moved slightly higher to 4.0% on an annual basis in September to remain near a 30-year high.
Read MoreThe service sector remains robust
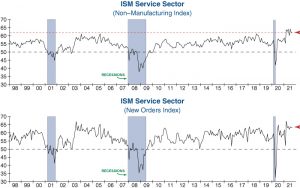
The ISM Services Index exceeded economists’ expectations by ticking higher to a reading of 61.9 in September.
Read MoreThe Fed has an inflation conundrum
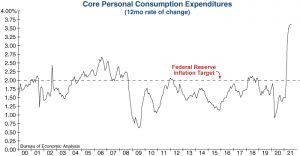
Core Personal Consumption Expenditures (PCE) –the Federal Reserve’s preferred inflation measure– edged up slightly to 3.62% from 3.60% for the month prior.
Read MoreConfidence continues to tumble in September
Consumer Confidence from the Conference Board continued to worsen in September as fears over inflation and the COVID-19 Delta variant persist.
Read MoreSpeculative Borrowing Re-engages
The latest margin debt reading showed that speculation regained momentum last month as it surged to yet another record high.
Read MoreThe Leading Economic Index continues to advance
The Conference Board’s Leading Economic Index (LEI) exceeded economists’ expectations by jumping +0.9% in August.
Read MoreHomebuilder confidence stabilizes… for now
NAHB Builder Confidence registered a warning flag last month after it fell sharply to a 13-month low, yet it managed to rebound by one point in September.
Read MoreInflation stays high as sticky prices are poised to pick up the slack
The Consumer Price Index ticked down to 5.3% from 5.4% last month and remained at one of the highest readings of the past twenty years.
Read MoreInflation continues to weigh on small business optimism
Inflation continues to weigh on small business optimism The NFIB Small Business Optimism Index increased by a meager 0.4 points in August (top graph) as small business owners continue to contend with both rising input costs and labor challenges.
Read MoreIs speculation starting to fade?
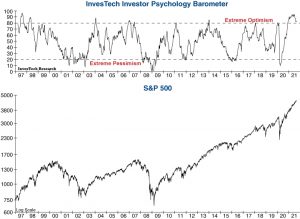
The speculative frenzy that was ignited by the trillions of dollars in monetary and fiscal stimulus since the pandemic began may be starting to dissipate, according to our InvesTech Investor Psychology Barometer (IIPB).
Read MoreProducer prices surge to record levels
The Producer Price Index (PPI) surged to an all-time high of 8.3% in its most recent reading, showing that supply/demand imbalances are persisting.
Read MoreManufacturing remains strong, but challenges remain…
The ISM Manufacturing Index moved higher to a reading of 59.9% in August to remain near one of the highest levels of the past two decades.
Read MoreConsumer confidence craters in August
Consumers became significantly more pessimistic in August due to a combination of persistent inflation pressures and fears over the Delta variant.
Read MoreThe Fed’s preferred inflation measure still running hot
Core Personal Consumption Expenditures (PCE), which excludes volatile food and energy prices, rose for the fifth straight month to 3.62% versus the prior month’s unrevised reading of 3.5%.
Read MoreLeading economic indicators show strength
The Leading Economic Index (LEI) from the Conference Board improved once again in July, taking the Index to another record high.
Read MoreLeading housing indicator raises a warning flag
NAHB Builder Confidence (top graph below) sank to a 13-month low in August after suffering its fourth largest drop of the past decade.
Read MoreSmall businesses voice concern about the future
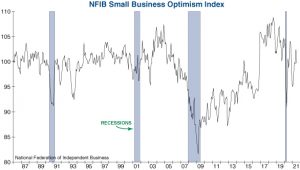
NFIB Small Business Optimism Index unexpectedly declined by -2.8 points to a reading of 99.7 as economic expectations retreated in July.
Read MoreManufacturing remains strong but moderates

The ISM Manufacturing Index declined by -1.1% to 59.5% in July, yet it remains at one of the highest levels of the past 30 years.
Read MoreThe Fed’s preferred inflation measure continues to rise

Core Personal Consumption Expenditures (PCE) –the preferred inflation measure of the Federal Reserve– climbed further beyond the central bank’s 2% inflation target to 3.5% last month.
Read MoreConsumer Confidence Steady Despite Inflation Concerns
Consumer attitudes were virtually unchanged in July...
Read MoreLEI continues to climb
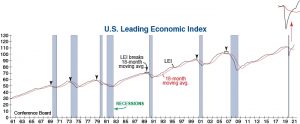
The Leading Economic Index (LEI) from the Conference Board gained 0.7% last month on positive contributions from eight of its ten leading components.
Read MoreMargin debt stays the course
Margin debt climbed in June for the eighth straight month as investors continue to borrow on margin to buy stocks.
Read MoreHomebuilders remain optimistic
Homebuilders became slightly less optimistic this month according to the National Association of Home Builders, yet their confidence remains higher than at any point prior to the COVID-19 pandemic.
Read MoreCOVID-19 recession declared shortest on record
The National Bureau of Economic Research (NBER) has officially announced that the pandemic-induced recession has ended.
Read MoreSmall business optimism improves
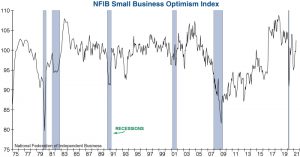
Small businesses became more optimistic last month as the economic recovery continued to gain momentum.
Read MoreInflation surges in June
The core Consumer Price Index (CPI), which excludes volatile food and energy prices, continued to surge in June.
Read MoreServices remains on solid ground

The ISM Services Index fell to a reading of 60.1% in June, still firmly in expansion territory and just 3.9% below its record high from the month before.
Read MoreManufacturing remains red hot

The manufacturing sector stayed soundly in expansion territory in June, as the ISM Manufacturing Index registered a strong reading of 60.6.
Read MoreConsumer confidence rebounds, but…

Consumer Confidence rebounds, but at what cost? Consumer Confidence from the Conference Board increased for the fifth consecutive month as pandemic woes continued to fade.
Read MoreLeading inflation indicator points higher

Inflation has emerged with a vengeance in recent months, and the FIBER Leading Inflation Index (LII) suggests that that pricing pressures are continuing to mount.
Read MoreConsumer optimism emerges, yet inflation lurks
Consumer optimism has been held down by the pandemic over the past year, but attitudes have started to improve as COVID-19 disruptions begin to fade.
Read More